Measure models in Microsoft Fabric Plan turn the measures in your Power BI semantic model into a plan you can forecast, simulate and optimize, without rebuilding them.
Organizations that report on Power BI spend years deciding what their numbers mean. This includes deciding which sales count as revenue, how margin is worked out and who belongs in the headcount. Those decisions are recorded in the semantic model as measures, and every report that reads from the model inherits them. It is the reason two departments looking at the same figure see the same number.
Planning asks something different of those numbers: how they change when people modify the assumptions behind them.
The usual route to a plan is to take the data out to a separate planning platform. Unfortunately, the logic and calculations in those measures do not travel with it. They need to be defined again in the planning model, and the plan and the reports now end up running on two copies of the business logic.
Fabric Plan takes a different approach. It leaves the definitions where they are and extends them forward, which Microsoft sums up as "Extend, Don't Rebuild". A measure model is the most direct way to do this: it works with the measures you already have, whatever they describe, and turns them into a plan that can be forecast, simulated and tested before anyone commits to it.
Know that this is possible only when you plan directly on top of semantic models. If your plan runs in a separate platform, this approach cannot be used.
In Fabric Plan, a measure model starts from the measures on a planning sheet and arranges them into a hierarchy that reads like the business (e.g., a P&L structure). Forecast measures give each actual a counterpart for the periods ahead, and formula measures combine measures into new ones. Scenarios, simulation and optimization then run across the whole structure. A change to one measure moves up through the measures that depend on it and across the rows at the same time, from a single country up to the total.
Let us explore this through an example.
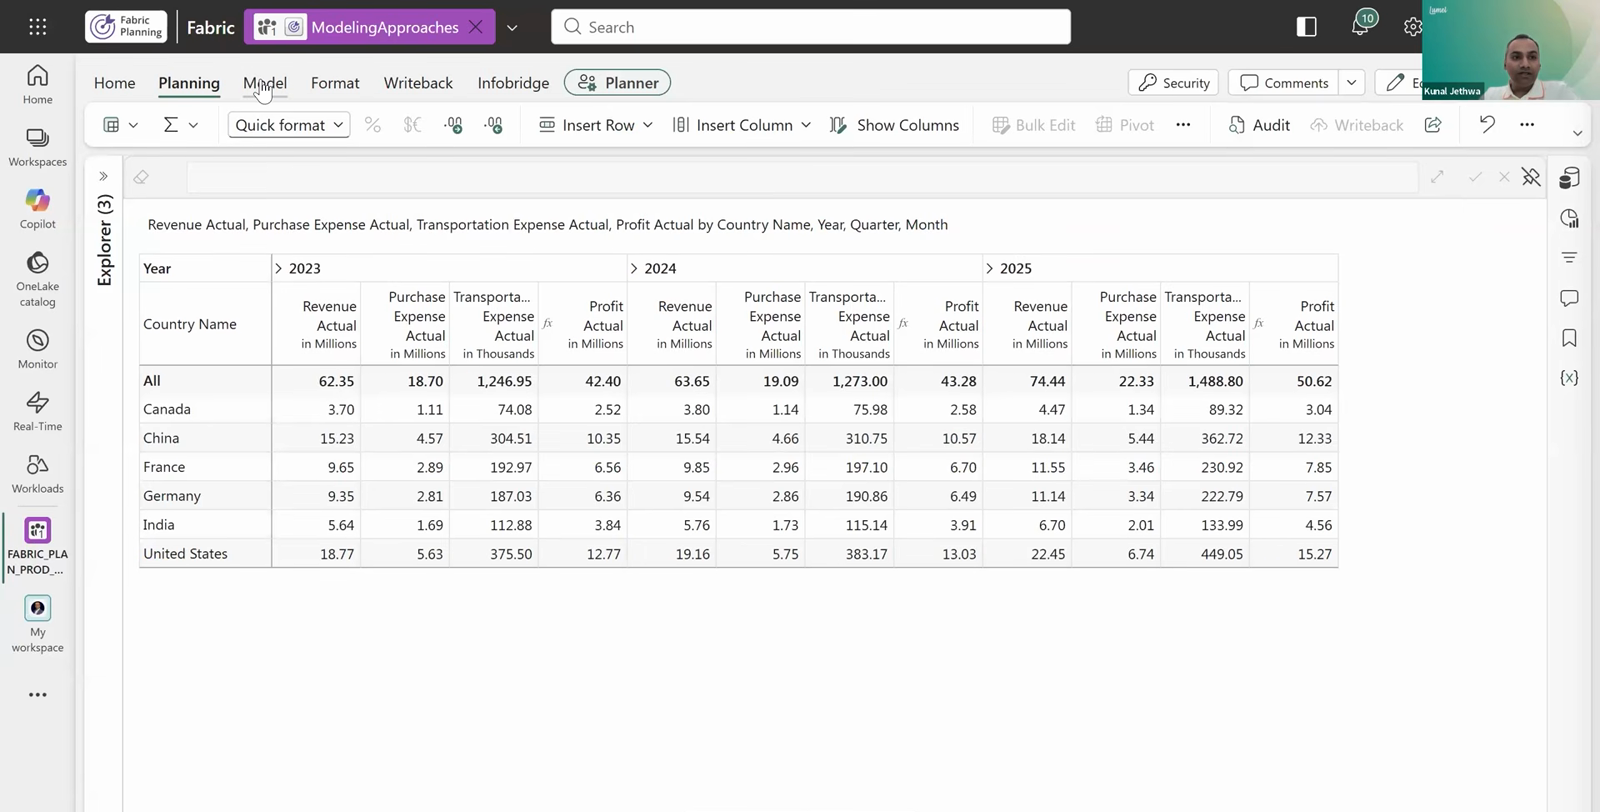
The example that follows shows actuals by country for 2023 to 2025. Revenue, purchase expense and transportation expense are native measures from the semantic model, and profit actual is a formula built on them. Nothing on the sheet is a plan yet.
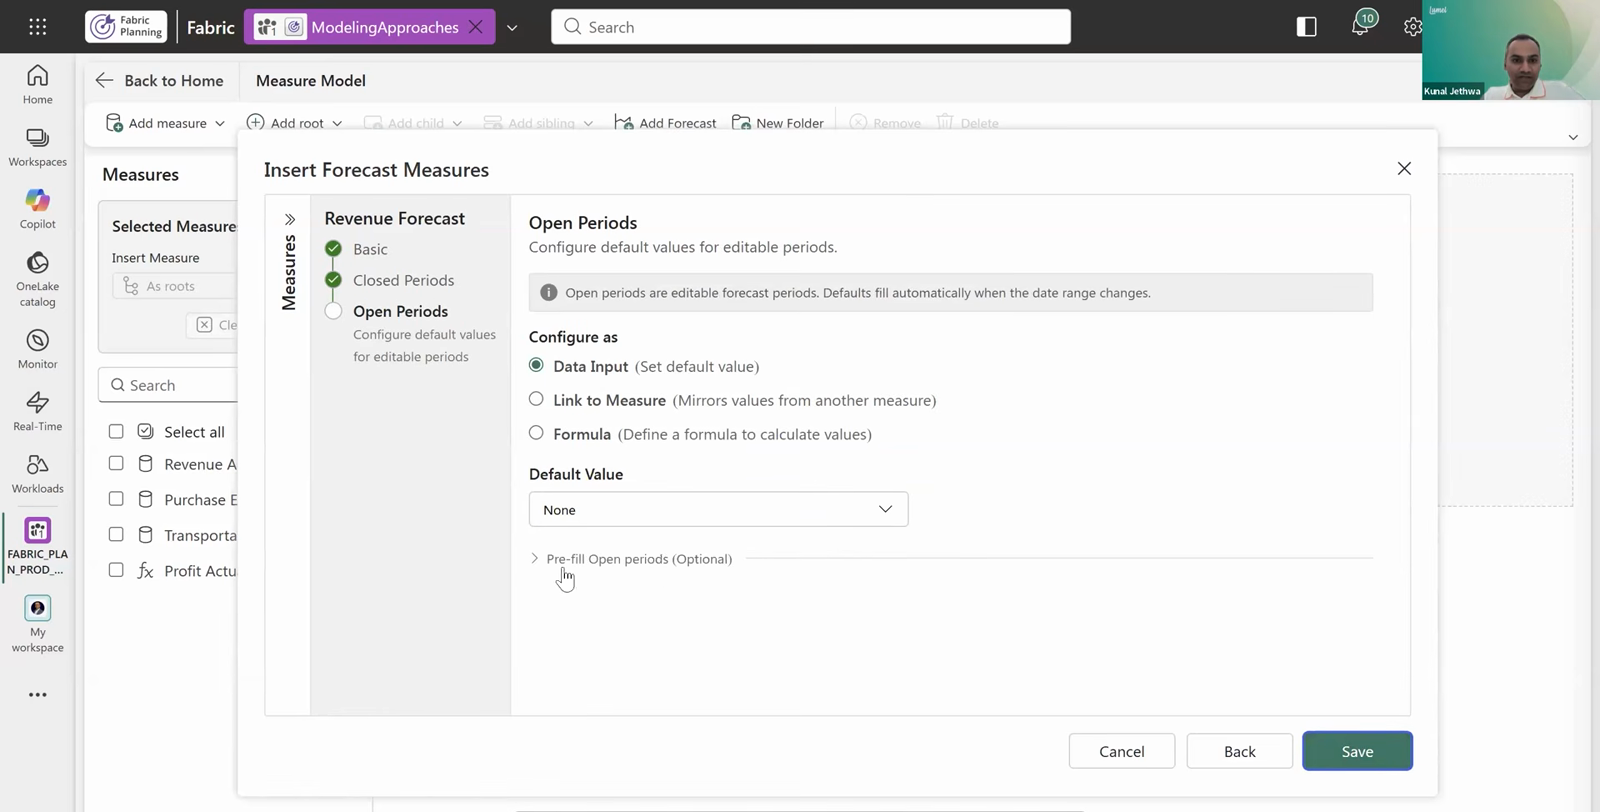
The first step adds a forecast measure for each of the three actuals, covering January to December 2026. For these forecast measures, you may opt to manually enter values (Data Input option), reflect the same values as prior year actual (Link to Measure option) or apply a growth rate of x% (Formula option) over the prior year value.
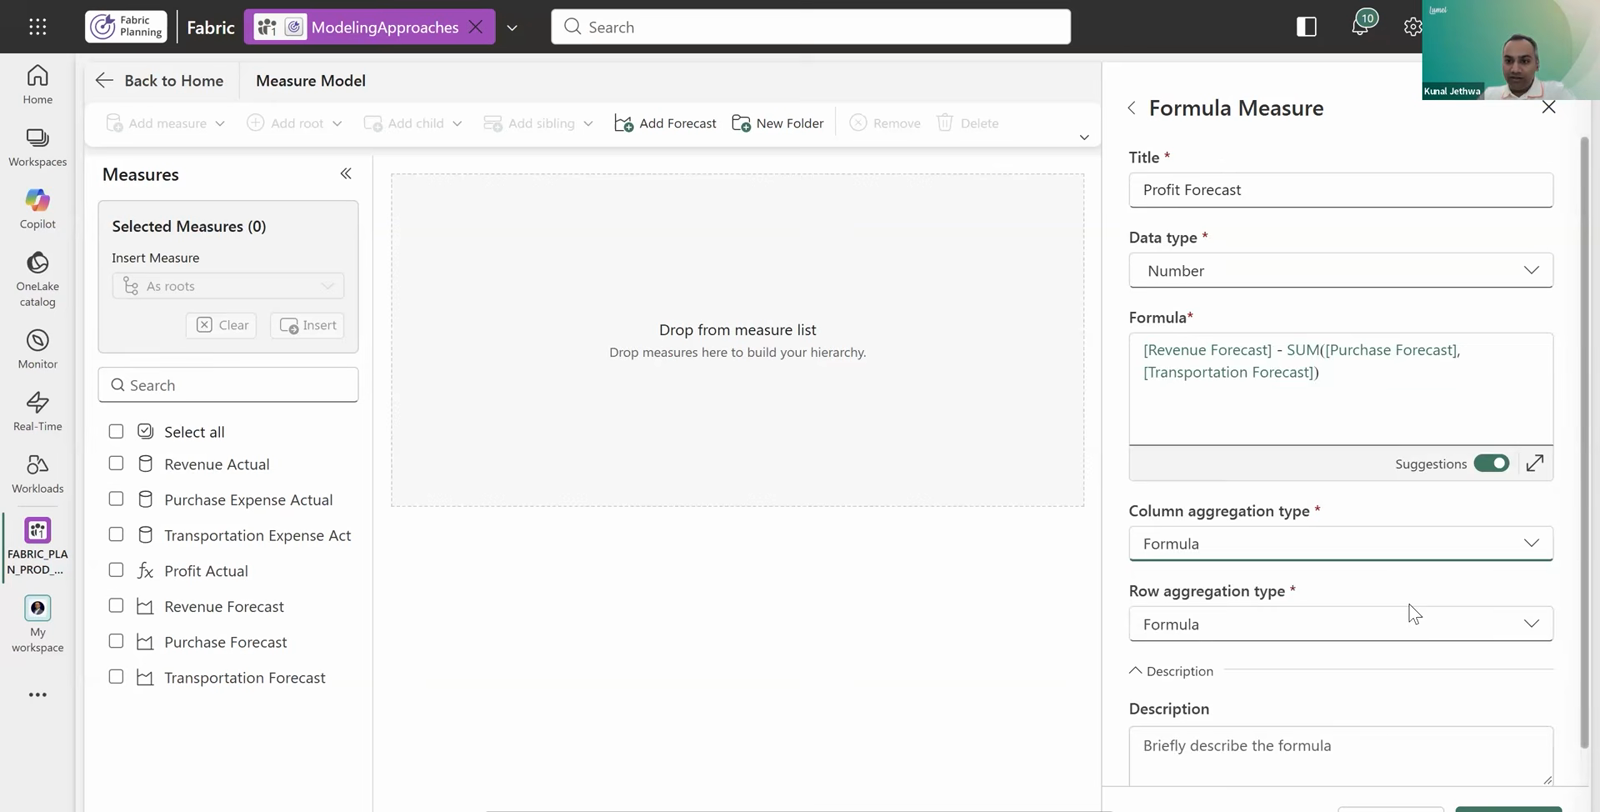
The Profit forecast is a single formula: revenue forecast less purchase and transportation forecast.
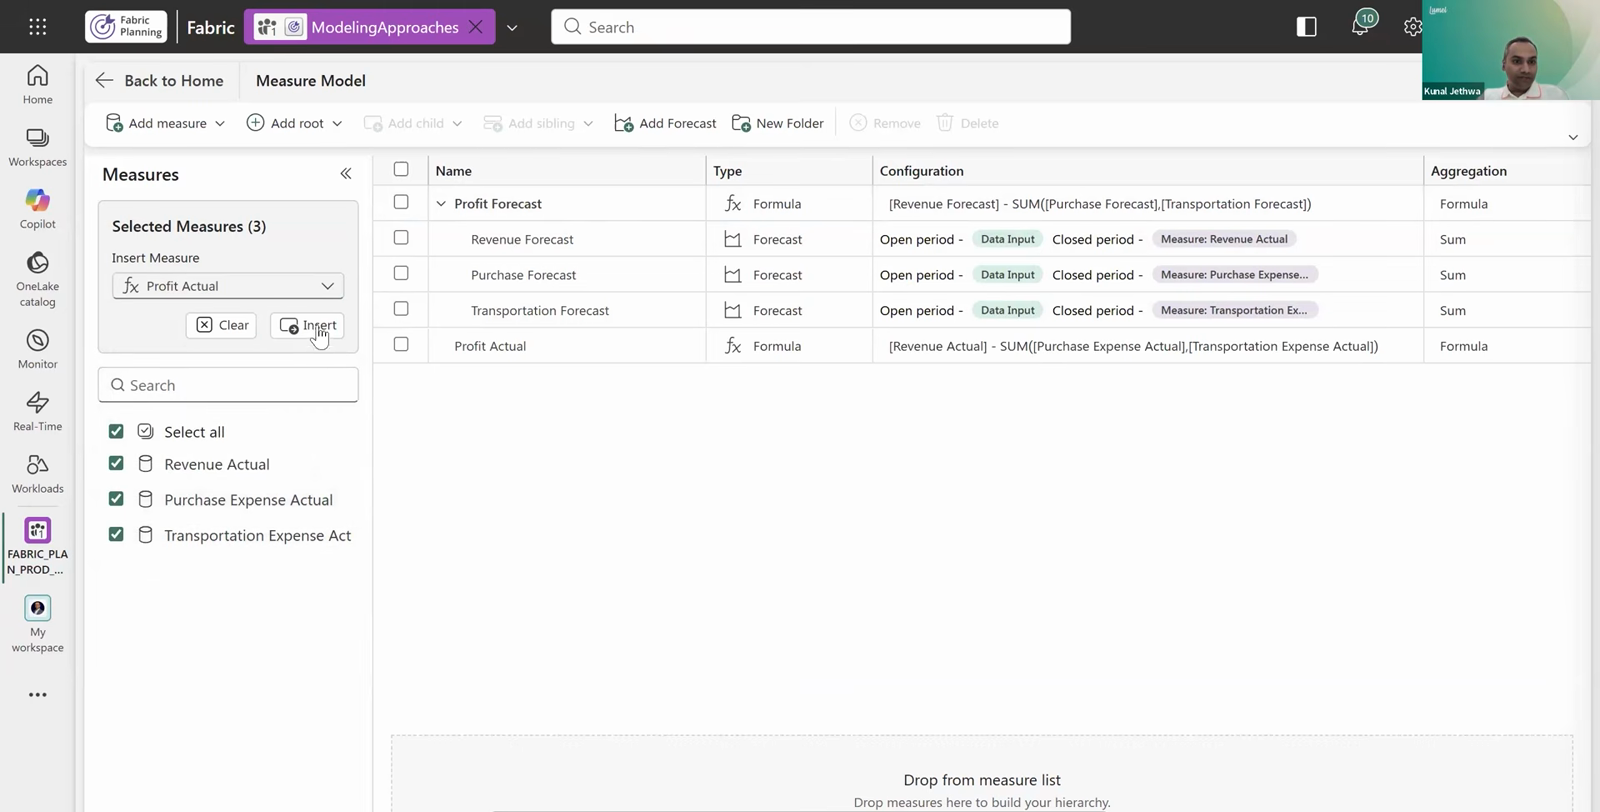
Profit forecast and profit actual then become parents in a tree structure, each with its three constituent measures beneath it. Everything up to this point takes under three minutes to build, and none of the actuals had to be re-created.
To build this yourself, follow the step-by-step tutorial.
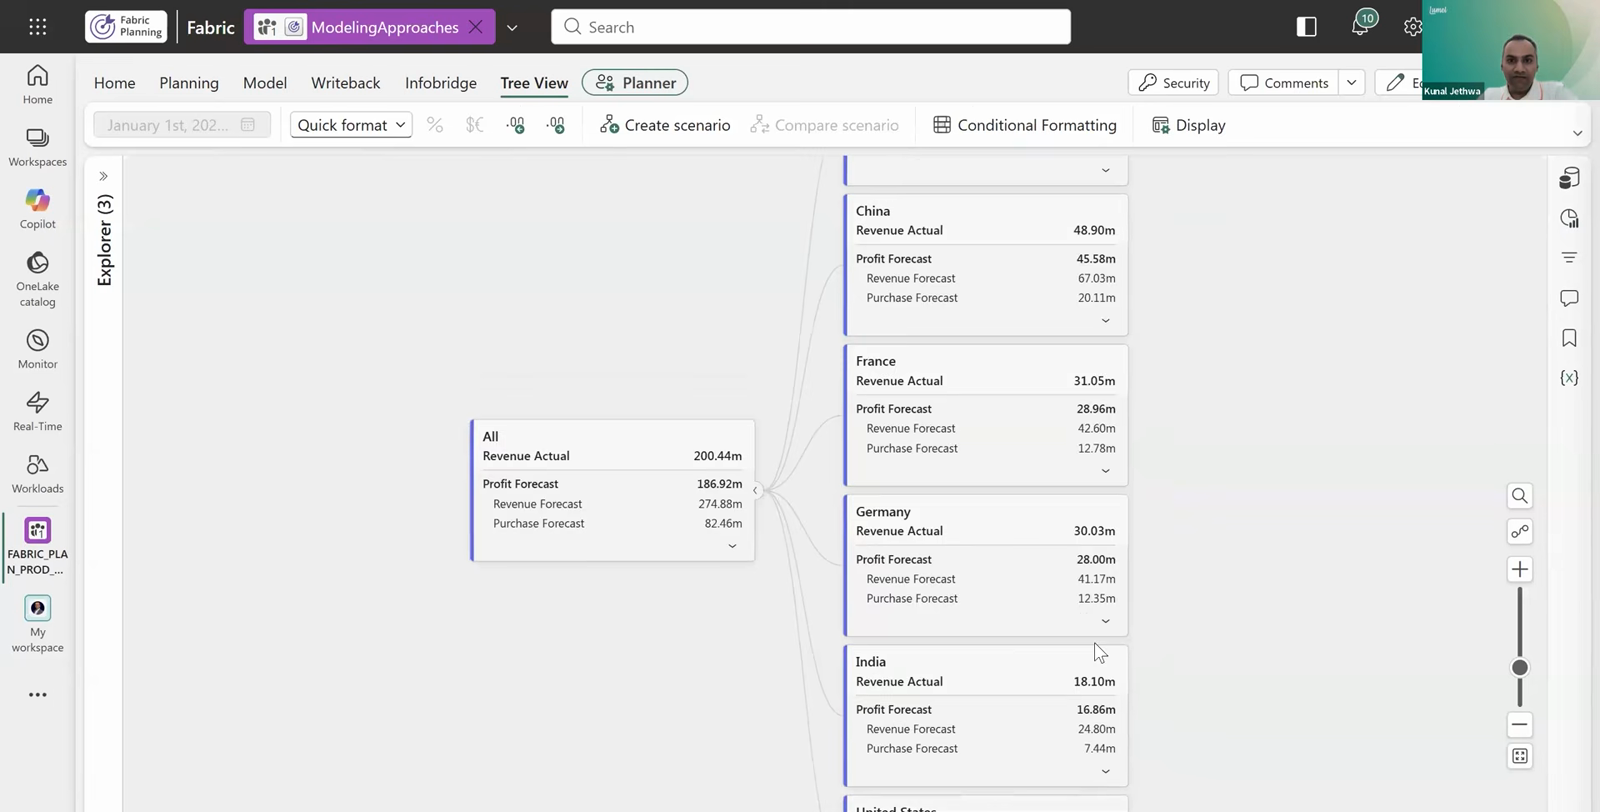
With the model in place, the tree view shows a profit tree for each country, with a visual structure.
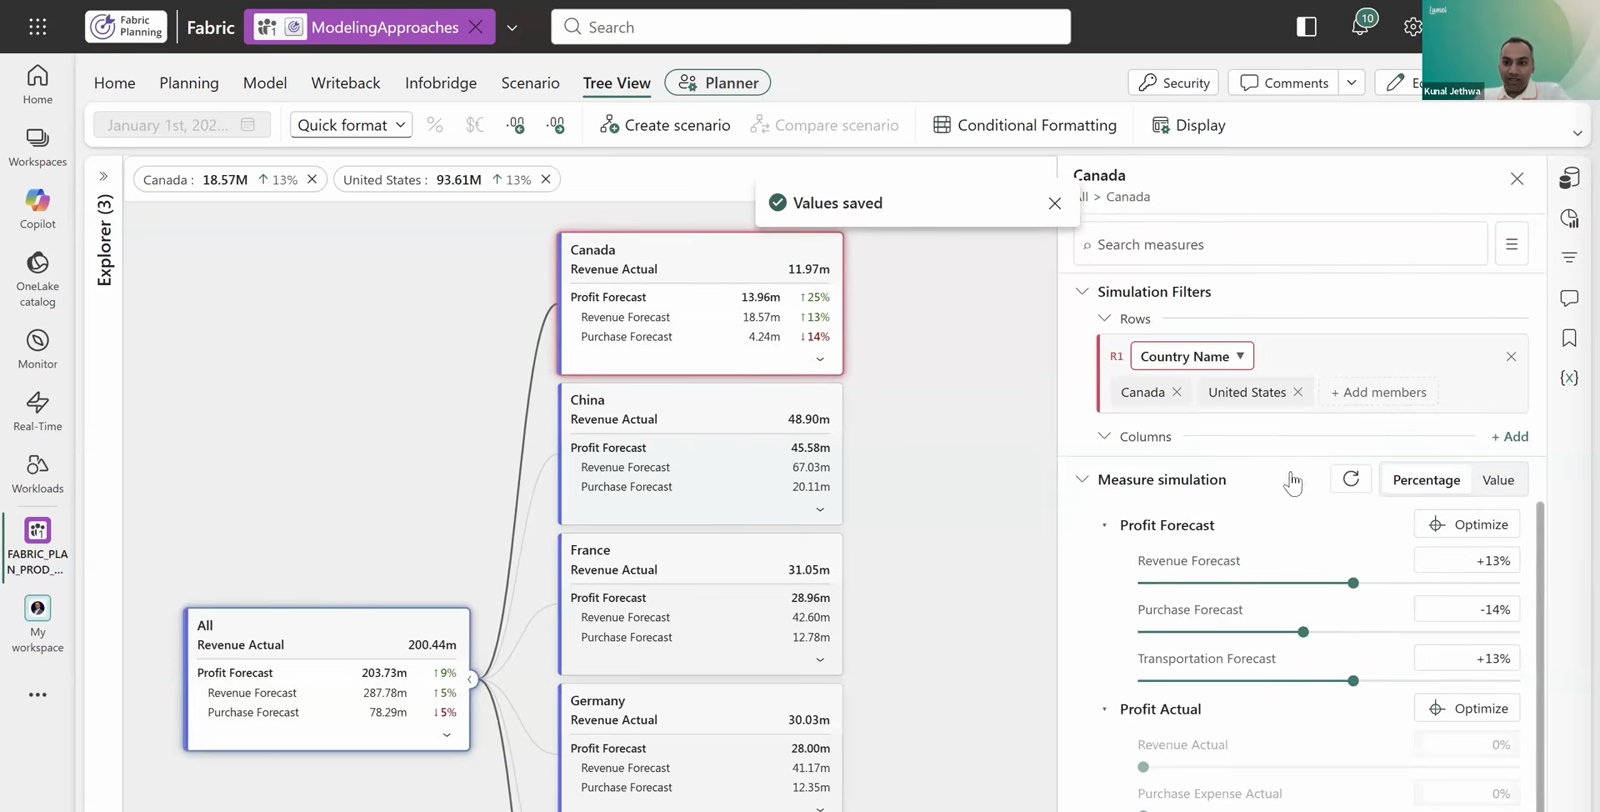
You can run simulations and create scenarios. In our case, revenue and transportation forecast are raised 13% and purchase forecast is cut 14%. This can be applied to both Canada and the United States together. Canada's profit forecast rises 25% as a result, and the overall company profit forecast increases by 9%. These simulations can also be scoped by column, to a quarter, a month or a year.
Simulation answers the question "what happens if these measures change?" The optimizer answers the reverse: what values should the measures take to reach a goal? The Fabric Plan optimizer is a multivariate goal seek. Excel's Goal Seek changes one input to hit one target; the optimizer changes several measures at once and keeps each within the limits you set. In the example it takes four steps.
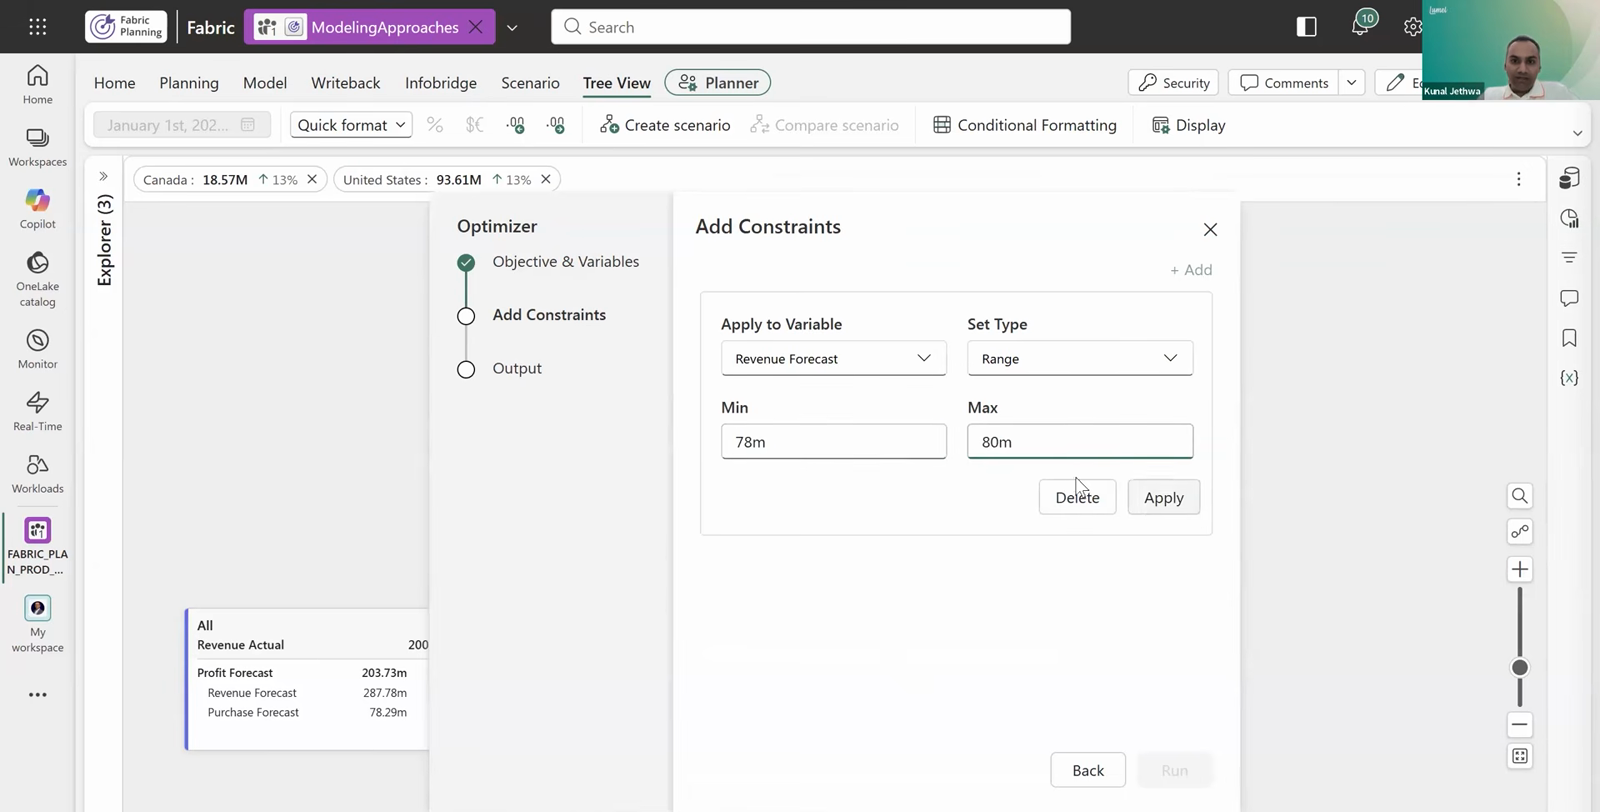
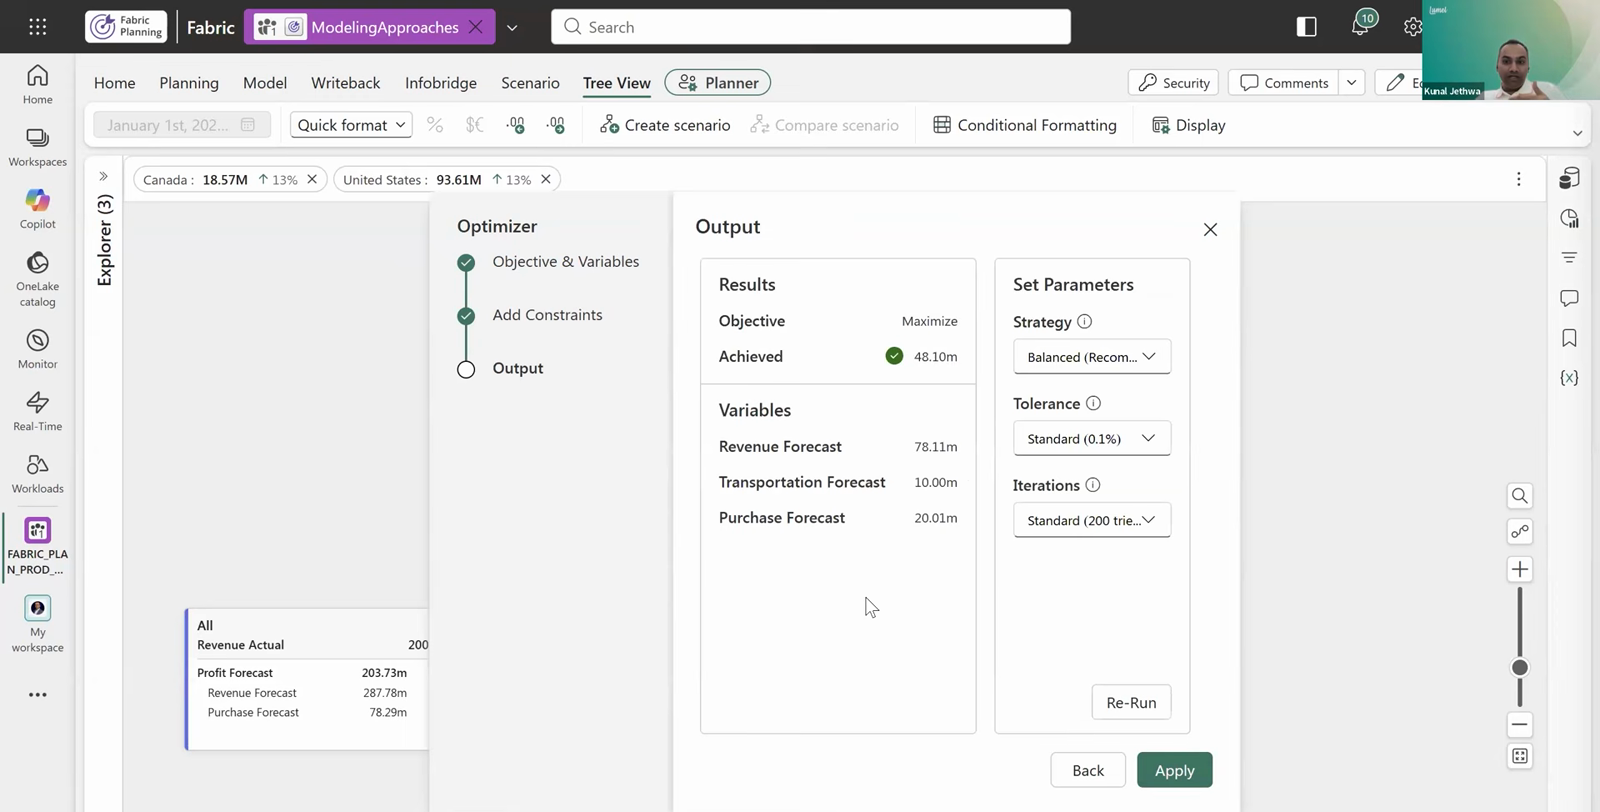
Once the values are applied, Canada's profit forecast and the company total get updated together. The limits in this example were set outside the range of its sample data, so the figures show the mechanics and say nothing about a realistic outcome. The finished scenario can then be compared with others side by side.
The optimizer is not limited to a three-measure tree. It also respects locked values, distribution rules and minimum and maximum rules through multi-level chains of dependent measures.
The example above has three measures. A real plan works with the measures an organization already reports on and runs at a much finer grain, and that is where a measure model is at its strongest. The illustrative product-line P&L below runs from gross sales to operating profit. Eleven of its measures already exist in the semantic model, with their logic written in DAX. The measure model gives each of them a forecast and adds seven formulas for the subtotals.
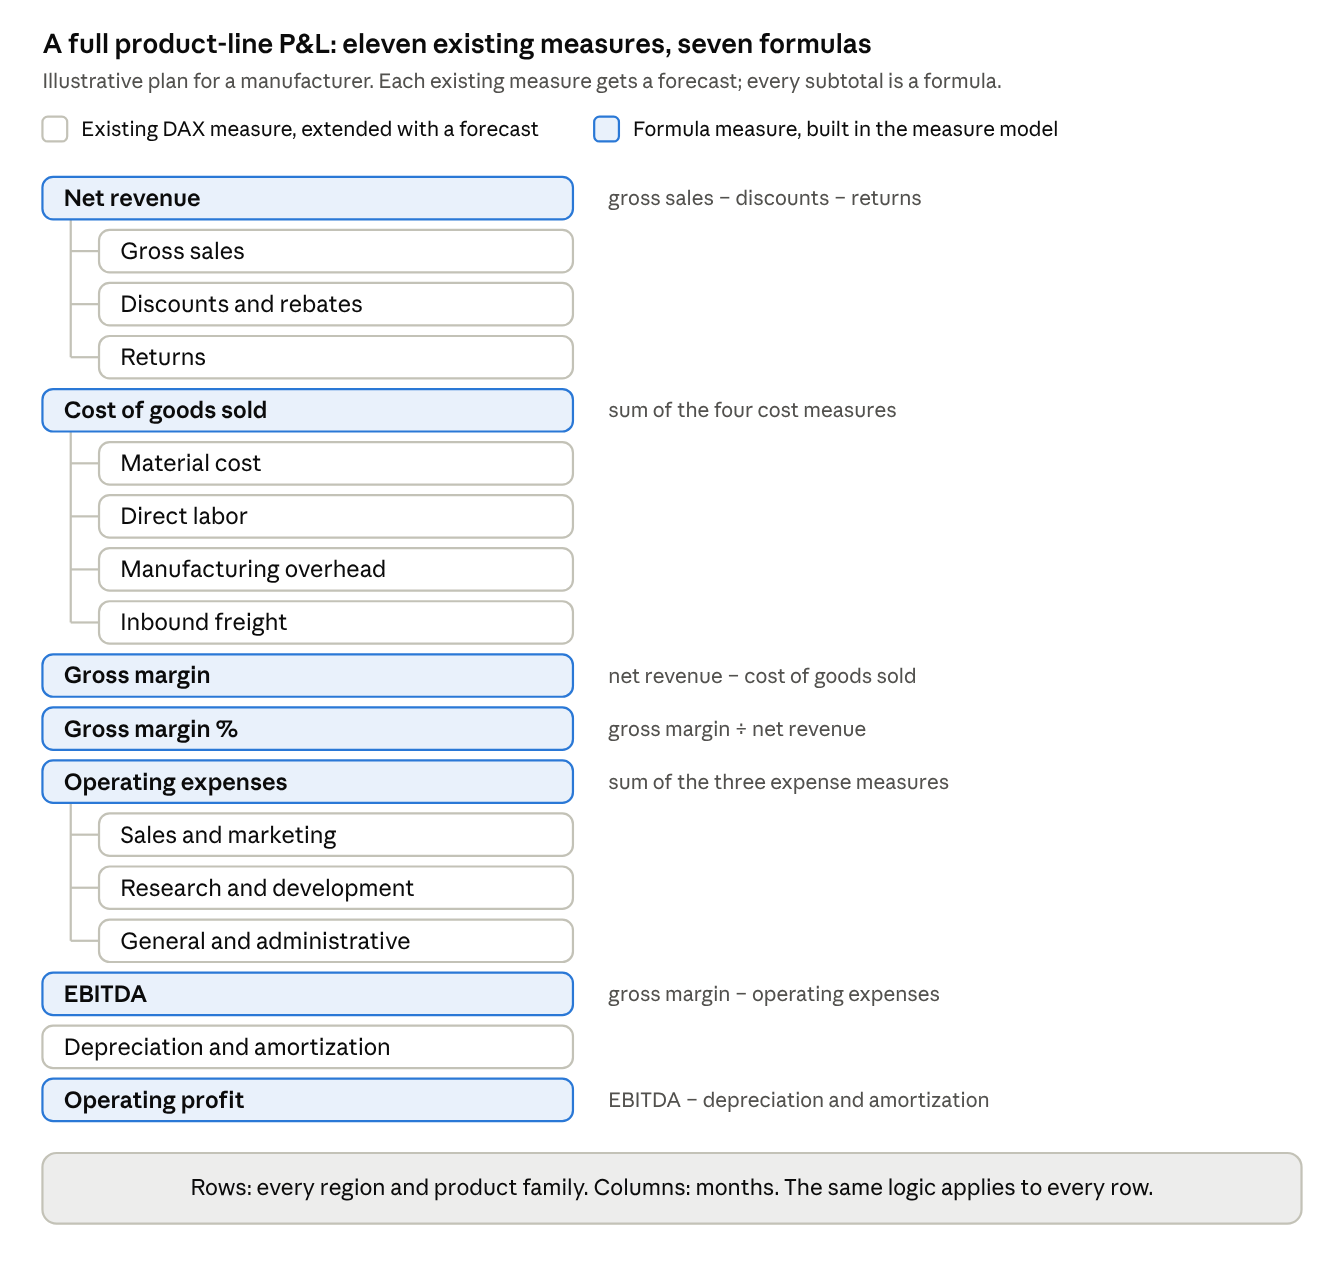
Illustrative product-line P&L · 11 existing measures, 7 formulas
None of the eleven measures is rebuilt. Gross sales may already convert currencies, and material cost may already apply standard costs. That logic stays in the semantic model, and each forecast starts from it. Planners enter forecasts by region and product family, and every subtotal from net revenue to operating profit recalculates. Because a measure model applies the same logic to every row, a new region or product family adds rows to the grid and leaves the model as it is.
Not every plan has this shape. When the logic has to be built line by line in the planning layer, with each line following its own rules, Fabric Plan offers row models in Model Builder. The Planning at Scale blog compares the two.
How quickly a plan goes live is decided mostly by what has to be built before anyone can capture a projection.
With Fabric Plan on a well-governed semantic model, that time-to-market is fast. The data is already in Fabric, the business definitions are already in the measures and row-level security defined on the semantic model applies to the plan without a second setup. What remains is the plan itself: forecasts, the formulas for results and the scenarios to test them. Lumel has seen customers with a strong semantic model go live on headcount planning in under a week.
A standalone planning tool like Anaplan, Pigment or OneStream starts further back. You begin by setting up the master data and bringing transactions from ERP, CRM and HR systems into the planning platform. This setup typically runs twelve weeks or more before any planning logic is rebuilt on top. Implementations of legacy suites such as Oracle Hyperion and SAP BPC typically take six to twelve months to go live.
Watch the full demo of measure models in Fabric Plan: Extend Plans with Measure Models in Microsoft Fabric Planning.




Comments
0Please log in to comment.