Key Considerations for Planning at Scale with Microsoft Fabric Plan
Lumel
Sep 2026
On this page
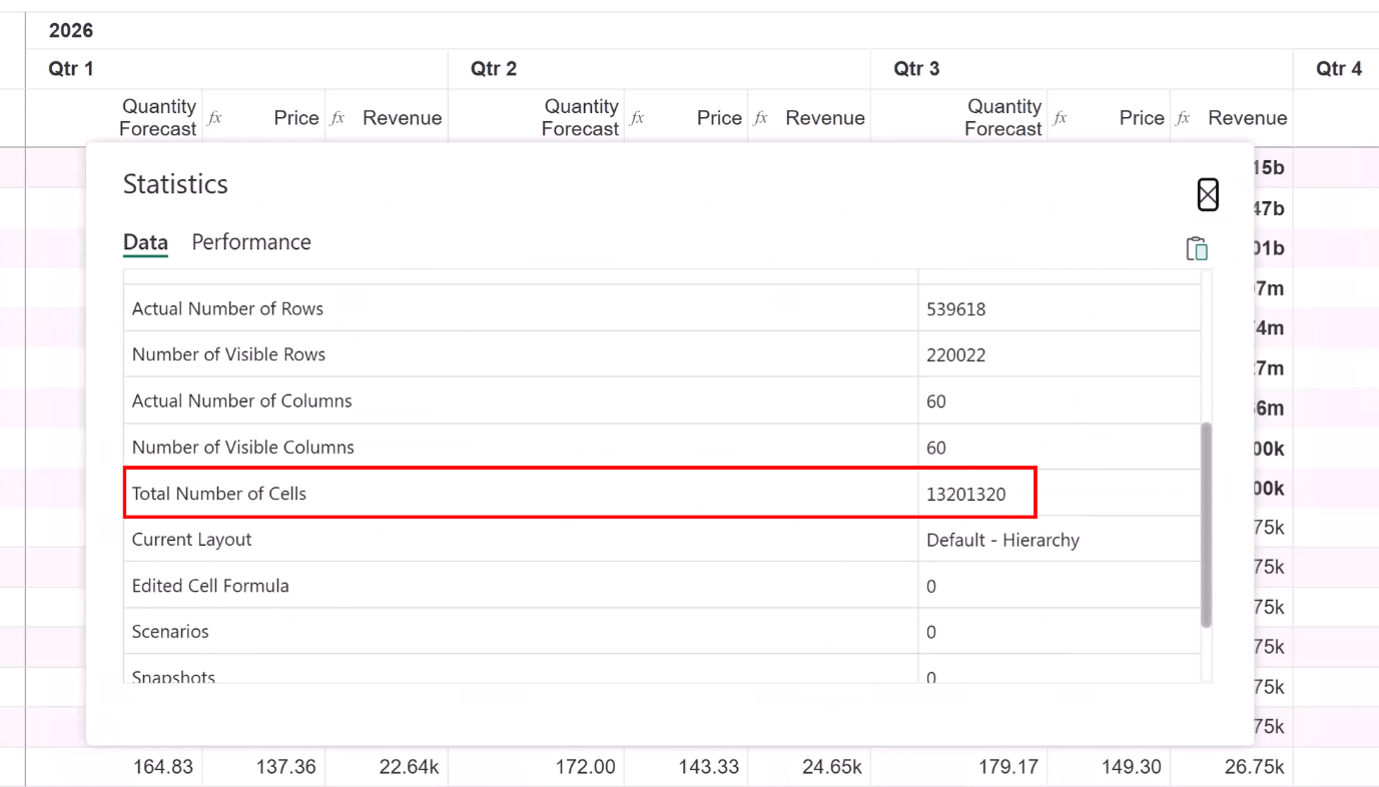
The new Native Planning Engine (announced at FabCon Europe 2026), now in preview, is built on Rust and Apache Arrow with tight OneLake integration. As shown in the image below, the architecture scales Fabric Plan to handle 12M+ cells in a single planning model, with dependent calculations updating across the model as inputs change.
This capability, along with the upcoming direct writeback to OneLake, will ensure that the easiest, self-service method of planning suffices for most organizations. OneLake writeback will extend the write support to more than 12M cells, compared to the 2.4M cells supported by Fabric SQL today.
Fabric Planning is the only EPM software that lets you incorporate a large number of dimensions, measures, scenarios and long time horizons in your plan. However, to plan at scale, choosing the right implementation approach is important.
Here are some key considerations to keep in mind when you want your models to scale.
A plan grid is smaller than the semantic model beneath it The semantic model under a plan can be any size, and billions of values are ordinary. A typical plan is a few dimensions down the rows, time periods across the columns and as many measures as you need. Plans are almost always created at an aggregate level, while the fact tables feeding them are highly granular. With filters and the row-level security (RLS) already defined on the semantic model, users plan on only a slice of enterprise data at a time. Most plans therefore don’t need more than 1 million cells. This scale is comfortable enough for most organizations, with a few exceptions.
Size how much data you pull from the semantic model This becomes relevant when you think of scaling further. A plan reads its data from a Power BI semantic model. The first thing to size is the fetch: how much data each user retrieves, and how many users retrieve it together.
There are several reasons why these matter. Large result sets take time to return. The Analysis Services engine throttles when several users pull that volume at once. Power BI capacity caps the data returned and the number of concurrent queries. A model that sits well inside the engine can still load slowly or fail under load if the fetch is left unsized.
Filters and RLS keep each fetch small This is where filters and RLS help. A planner who owns a single cost center or region needs only that slice, and the filter that scopes the work keeps the fetch small. RLS defined on the semantic model applies to the plan with no second setup. The same applies on the way out. Writeback can be scoped by filters across dimensions and measures, so only what is needed is written, which reduces the volume.
The full model is reserved for the few who allocate across it A few power users do need the entire data set, usually to run allocations at the grand-total level. This is where the engine's capacity is used: input and allocation across a large, detailed model that stays in one piece. Design for these users as the exception.
Large detail calls for a different method Cell counts explode when you plan on leaf-level dimensions such as customer, employee, vendor or material/SKU. A grid at that grain has a very large number of cells, and that brings performance challenges. Fabric Plan offers several modeling options for this, so explore them rather than simply enlarging the grid. It is important to do this assessment upfront and get the modeling right. There are four options to scale, chosen by the shape of the plan as much as its size.
a) Context Filtering,explored above, is the default option and fits most planning use cases. It is why most plans stay within about 1 million cells.
b) Dimension Partitioning extends a plan across several sheets. For example, a global sales plan can follow one template for each country, captured in different planning sheets. This allows each country to plan in its own currency and grain. InfoBridge is used to consolidate the results of these individual plans. (It is called Dimension Partitioning because you are partitioning a dimension, country in this case, across planning sheets.)
c) Multi-Dimensional Breakdown, delivered by Cube, suits plans that are multi-dimensional by nature, with a large number of dimensions. In any visual layout, you start noticing the clutter once you incorporate more than 10 dimensions. While you can incorporate even 16 hierarchical dimensions in Fabric Plan, you need not clutter the grid. Instead, you can build multiple planning apps, each focusing on a subset of dimensions: country and product in one, segment and customer in another. Values entered on the visible dimensions allocate to the hidden ones by weights, and a change in one app shows in the others with no rebuild. This can scale a plan from 10 million to 100 million cells.
d) PowerTable Integration is reserved for the leaf-level grain described above. The detailed plan is captured in a PowerTable sheet and rolls up live into the planning sheet. Because that detail is synced live with Fabric SQL tables, its scale is counted in rows: 1 million to 1 billion, with the ceiling set by the capacity behind the database.
Driver-based Plans (Row Models) vs. Measure Models
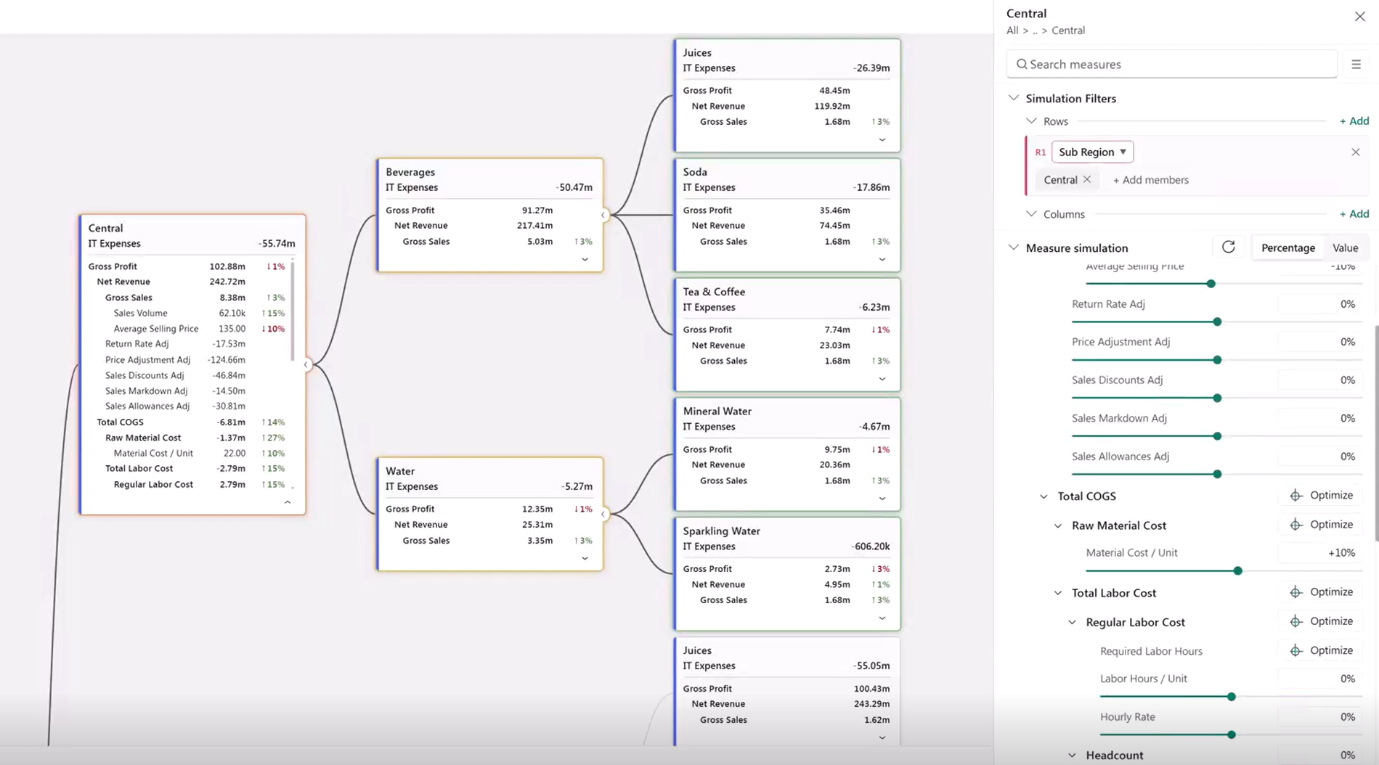
A lightweight semantic model, consisting mostly of flat tables, a star schema or transactional views, may not have a lot of logic incorporated in it. So the logic goes in the planning layer instead. That is a row model, built in Model Builder: a hierarchy of rows with formulas relating them, where every row is a potential driver. This enables driver-based planning in Fabric.
But what if you have invested a lot of time and effort in a semantic model with a lot of DAX measures? Your logic is already captured in the semantic layer. In such cases, you would rather extend the measures already present there into your planning template. This is made possible by measure models. They save much of the work of building and linking rows that a row model needs. Note that a measure model is scoped to the sheet it is built on.
Here is a quick comparison between measure and row models
Question
Measure model
Row model
Is the logic the same for every row?
Yes
No, each line differs
Where do planners type?
At member grain (SKU, employee)
At statement lines or drivers
How many rows?
Hundreds to many thousands
Tens to a few hundred
Does adding a member mandate a model change?
No
Usually yes, unless a template covers it
Does adding a version require a model change?
Not if the version is a dimension
Not if the version is a new measure the rows already handle
What varies across columns?
Measures, or members of any column dimension including version and time; each measure's logic can be scoped per member
Measures or versions; each row's logic can be scoped per measure
Recommendations
Choose a method based on what you want to accomplish, and the data volume involved.
What are you trying to accomplish? Is it a top-down financial plan, bottom-up operational plan, driver-based plan, scenario plan, strategic plan or something else? Do you require multi-currency planning or high-dimensionality planning? The answers shape everything downstream.
High-volume line-item or grain-level planning? Explore PowerTable.
Typical aggregate plans (e.g., a financial plan or a sales plan) start in the planning sheet with Context Filtering and RLS. If you need to incorporate more data, do not simply enlarge the grid. Size the fetch and explore the alternative planning methods listed here.
When you have a large number of dimensions, or when you don’t need to present all the related dimensions, explore Multi-Dimensional Breakdown with Cube.
Multi-currency plans, or plans that differ by country? Explore Dimension Partitioning.
Opt for driver-based plans to focus on how key business drivers can impact financial outcomes. If the logic already sits in DAX measures, extend it with a measure model.
Do not mandate one method for everyone. Let every team explore what works best for them.




Comments
0Please log in to comment.