A logistics organization manages employee, warehouse, and shipment information across multiple locations. While different teams work with the same data, they do not all need access to every column.
Row-level security controls which records each user can see, but on its own it cannot restrict columns. Anyone with access to a record could see every column in it, including salaries and other sensitive details. That gap made it hard to share one table safely across teams.
PowerTable Column Access closes that gap by bringing column-level security to PowerTable. You can control who can view, insert, or update each column, role by role, while every team keeps working in the same shared table.
Here’s how it works in a logistics organization.
In this post:
One shared Employees table serves three teams with different needs.
Consider a logistics organization with 50 employees managing operations across five warehouses: Newark Gateway Logistics Park, Atlanta Southern Distribution Center, Chicago O’Hare Freight Hub, Dallas Lone Star Logistics Hub, and Los Angeles Pacific Port Terminal.
The Employees table contains Employee ID, Employee Name, Designation, Department, Work Email, Hourly Rate, Monthly Salary, Salary, Performance Rating, Is Active, and Warehouse Assignment.
Without column-level access, users may be able to view or modify information that is not relevant to their responsibilities.
Column Access gives each column three permissions per role. Read shows or hides the column. Insert controls whether a user can enter a value in a new row. Update controls whether a user can change a value in an existing row. Settings apply to all roles or to specific roles, and when a user has several roles, an access is granted if any of those roles grant it.
Turn off Read for a column, and it disappears for that role everywhere in PowerTable.
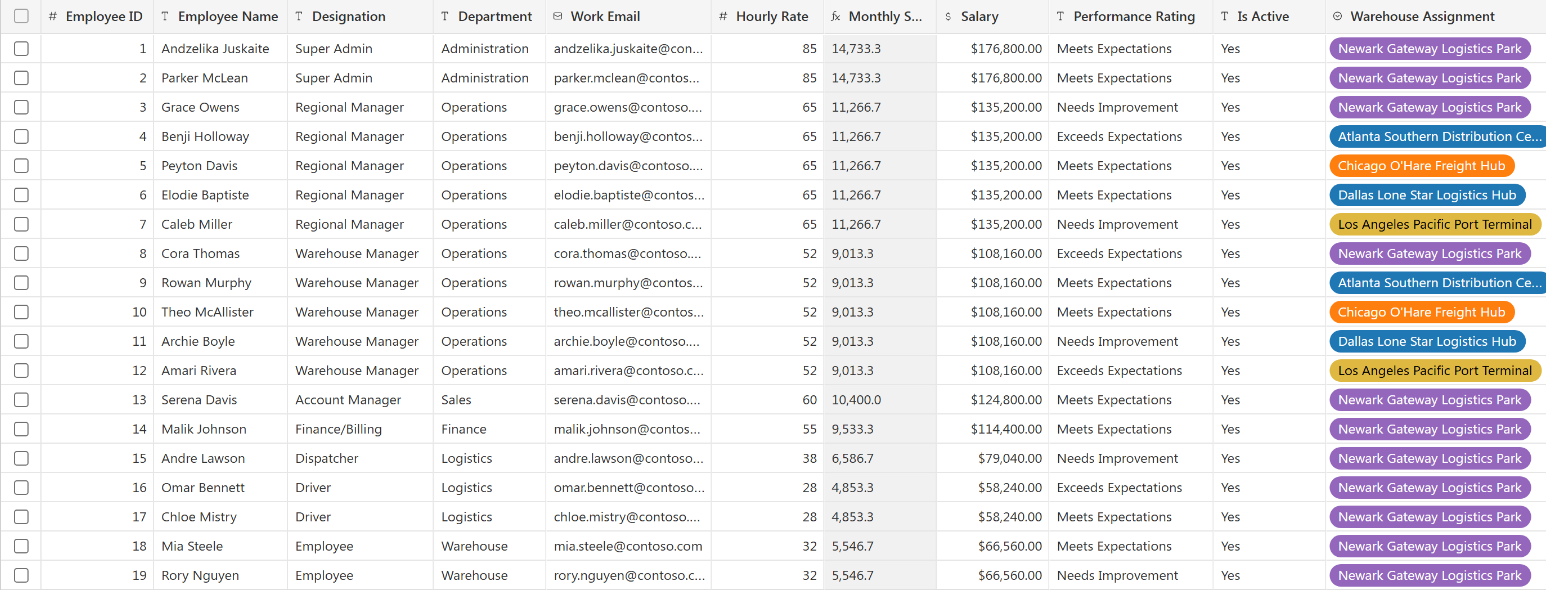
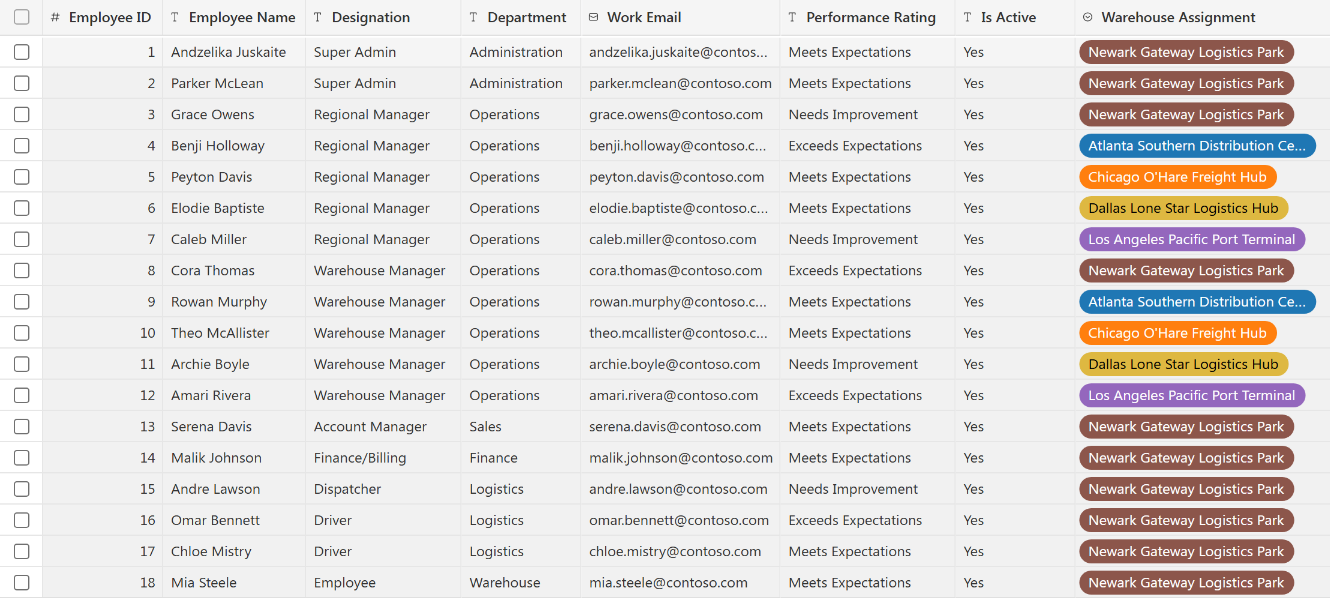
Problem: The HR team needs Salary, Hourly Rate, and Monthly Salary, but Warehouse Managers and Logistics Coordinators should not see them.
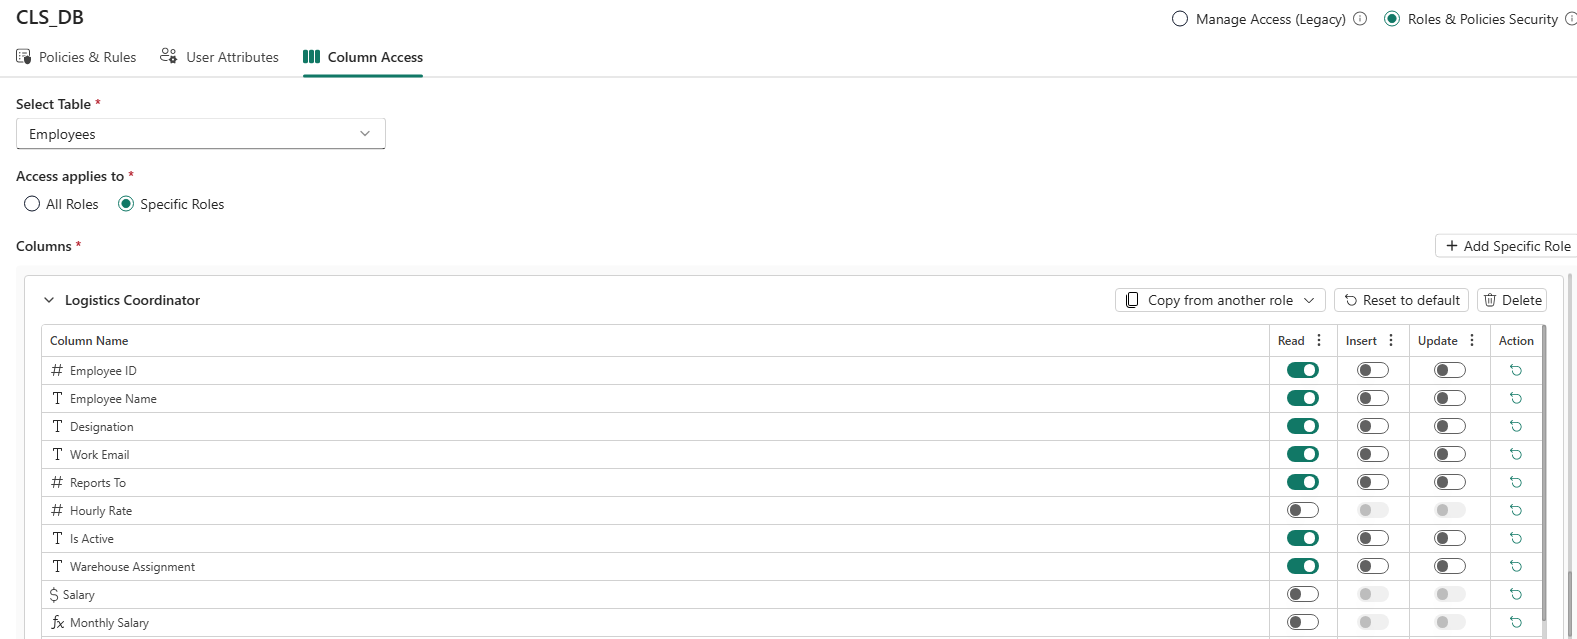
What changes: You can turn off Read for specific columns and roles. The column is hidden from the grid and from other product areas where columns can be selected, and Insert and Update are disabled for it.
| User role | Column access |
|---|---|
| HR Team | Can view all columns |
| Warehouse Manager | Salary, Hourly Rate, and Monthly Salary are hidden |
| Logistics Coordinator | Salary, Hourly Rate, and Monthly Salary are hidden |
What each role sees
How to configure
Turn off Update for a column, and users can still see its values but can no longer change them.
Problem: Warehouse Managers need to keep the Is Active status of their team current, but should not change other employee details such as Department or Designation. Logistics Coordinators only need to view employee details. HR must keep the ability to update them all.
What changes: Update is controlled independently for each column. With Read on and Update off, the column is view only.
| User role | Department | Designation | Is Active |
|---|---|---|---|
| HR Team | View and Update | View and Update | View and Update |
| Warehouse Manager | View only | View only | View and Update |
| Logistics Coordinator | View only | View only | View only |
What it looks like

How to configure
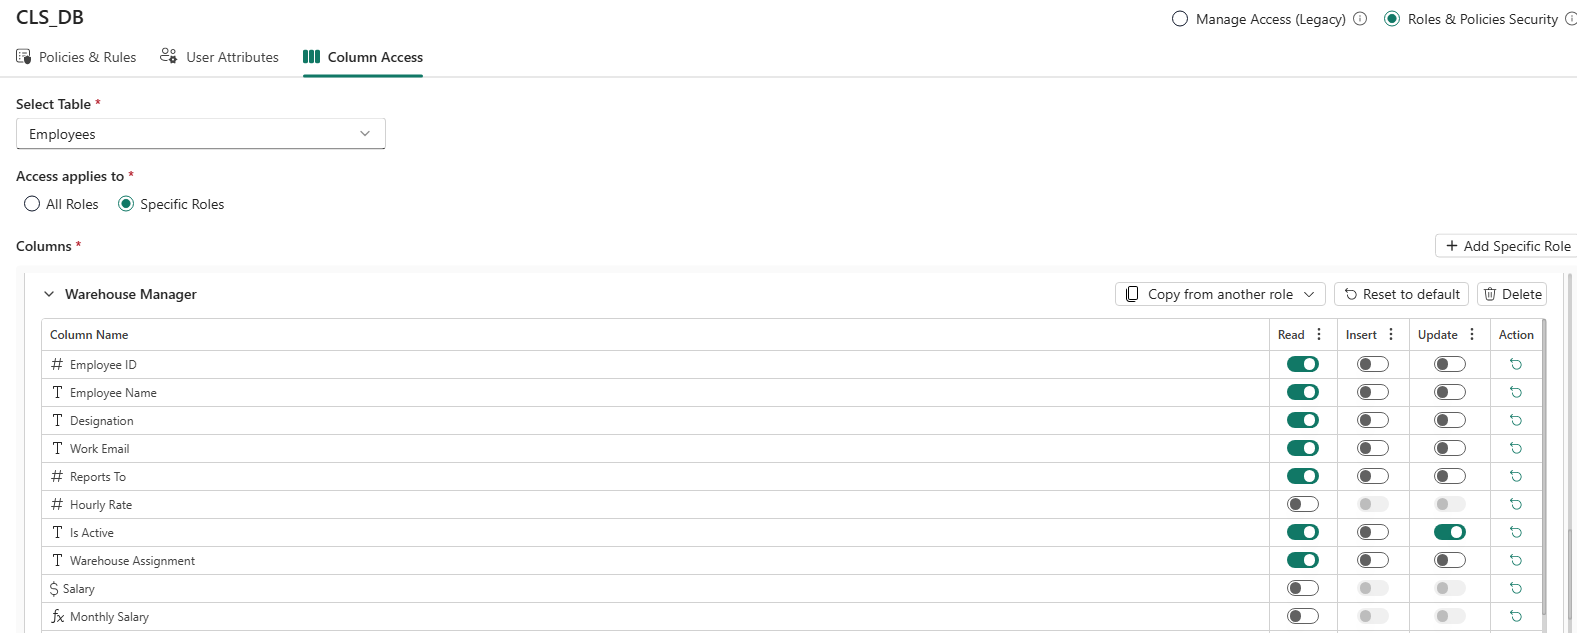
Pair Column Access with row-level security to control both which records and which columns each user can reach.
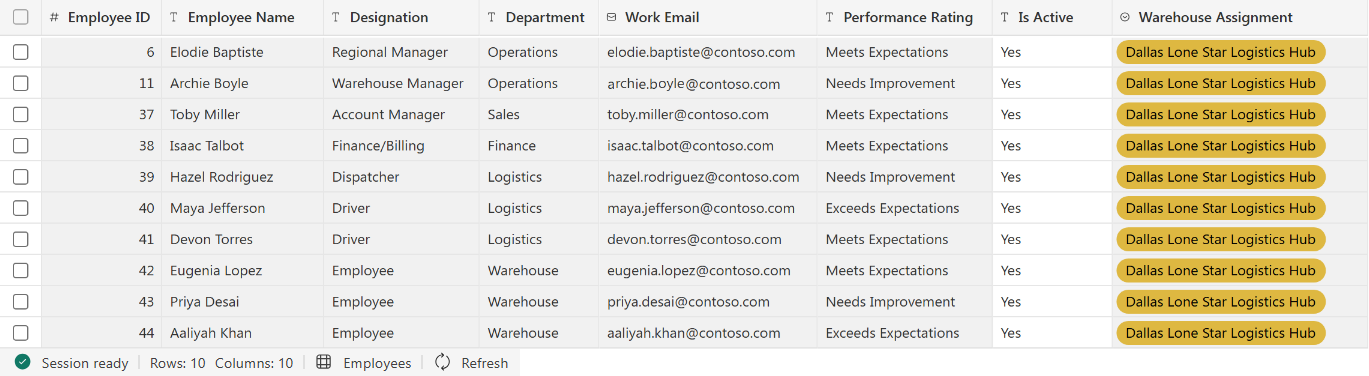
Problem: Each Warehouse Manager should see employees only from their own warehouse. The Dallas Warehouse Manager, for example, should not see records from Newark, Atlanta, Chicago, or Los Angeles. Column Access controls columns, not rows.
What changes: Row-Level Security (RLS) decides which records a user can access, and Column Access decides which columns. A policy limits the Dallas Warehouse Manager to records where Warehouse Assignment is Dallas Lone Star Logistics Hub, and Column Access hides Salary, Hourly Rate, and Monthly Salary for the Warehouse Manager role.
| Access requirement | Result |
|---|---|
| Warehouse-level access | Only the 10 Dallas employee records |
| Column-level access | Salary, Hourly Rate, and Monthly Salary are hidden |
What it looks like
How to configure
Column Access completes PowerTable’s security model. Together with row-level security, it controls both which records and which columns each role can view, insert, and update.
One shared table. The right access for every role, down to the column.
Ready to secure your shared tables?
Feature details reflect Fabric Plan at the time of writing.
PowerTable turns your Fabric data into a no-code app. Teams can edit, track, approve and govern their data, right where it lives. From master and reference data to products, projects, tasks, timesheets and budgets, every team gets one secure place to work. No exporting to spreadsheets, and no waiting on IT. New to PowerTable? Start with What are PowerTable sheets in planning? on Microsoft Learn.
The PowerTable November 2026 release brings exciting enhancements across data management, analytics, project management, and automation. We’ve strengthened Security & Governance, enhanced Microsoft Teams integration across approvals and automations for more proactive tracking, and introduced JSON data type support to expand unstructured data capabilities. Crosstab gets richer pivot functionality, while Kanban brings improvements for easier data updates and tracking. We’re also introducing Earned Value Management metrics in Gantt to help monitor project and task health.
PowerTable security now lets you control who sees and changes each column, and who manages the security settings themselves.
Column Access, in Security, sets Read, Insert and Update permissions for each column of a table, per role. Read shows or hides the column. Insert controls whether a user can enter a value in a new row. Update controls whether a user can change a value in an existing row. Settings apply to all roles or to specific roles. When a user has several roles, an access is granted if any of those roles grant it.
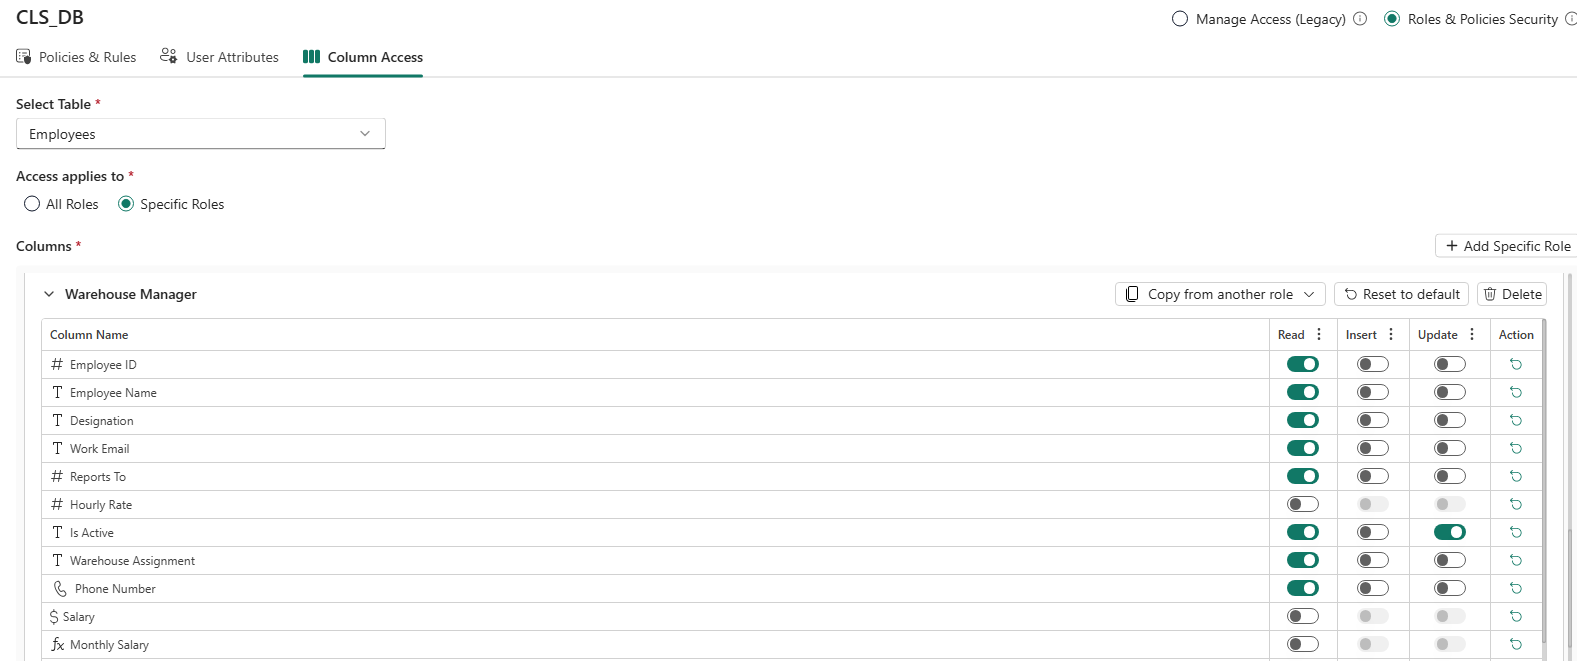
Use case: An HR team shares one employee table with the whole business. Managers can see salaries for their reports but can’t change them, while HR administrators keep them up to date. For everyone else, the salary column simply isn’t there, so one table serves every team with no oversharing.
For a full walkthrough, see Column Access: Column-Level Security for PowerTable.
The new Security access page sets whether Workspace Contributors can edit security and governance settings. Choose Yes for all Contributors, No for none, or Specific Contributors only for the Contributors you add to a list. The item owner, Workspace Admins and Workspace Members always have full edit access. The setting covers roles, user attributes, policies, approvals, row and column access, and creating and deleting sheets. It does not affect editing table or planning data. The same page also links to OneLake security, where you control who can access writeback data in OneLake.
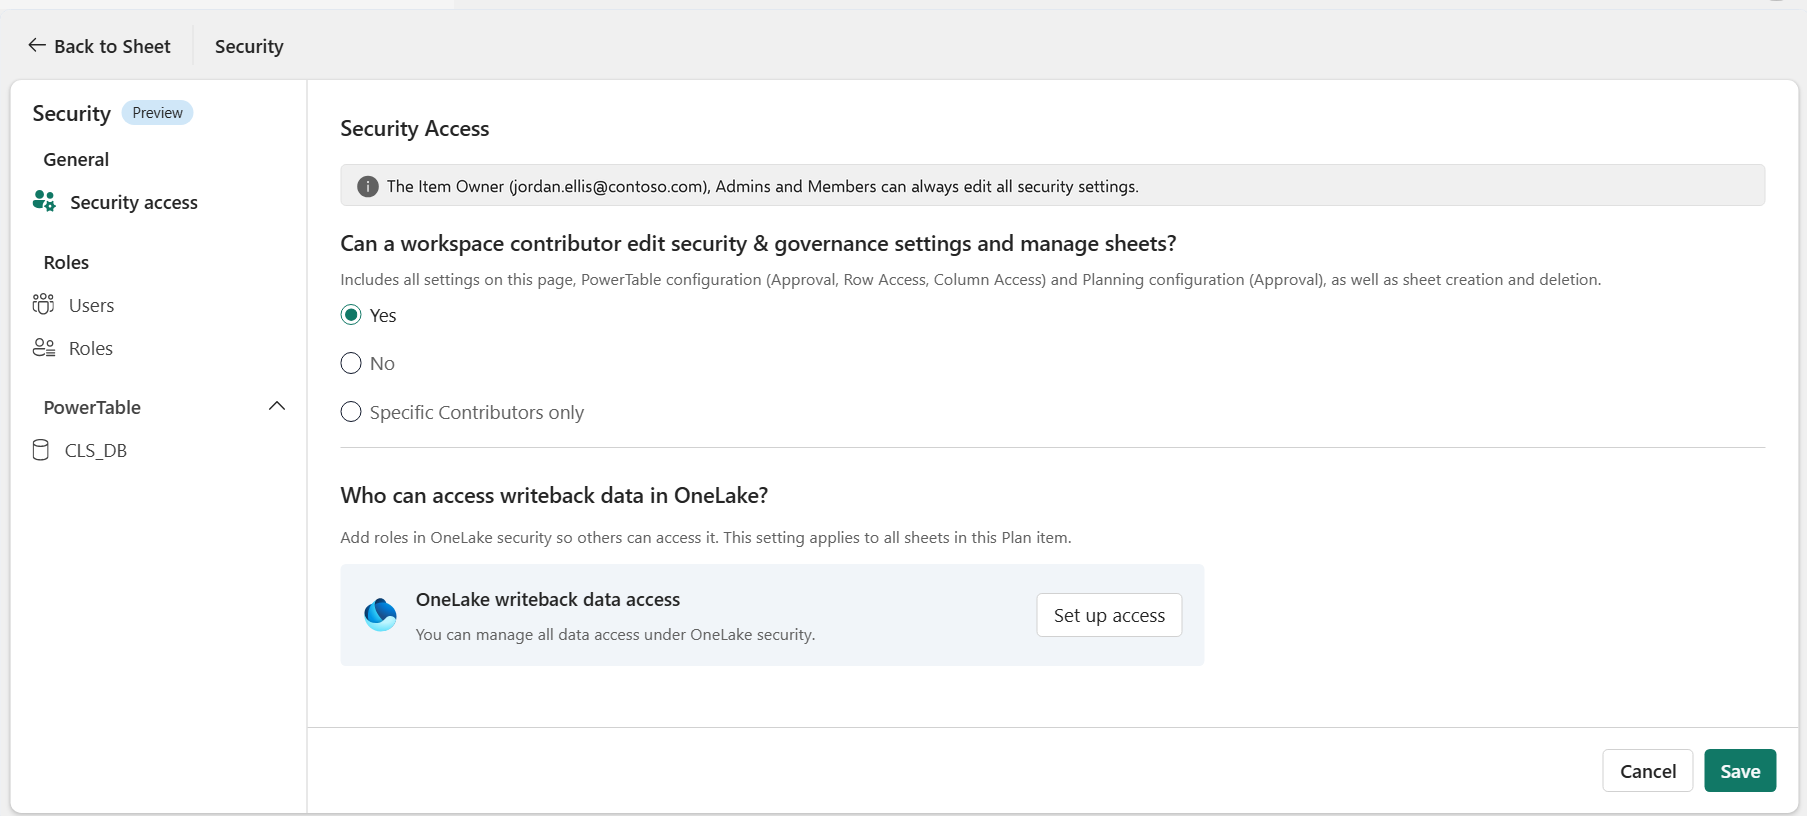
Use case: A finance team works in a shared budgeting workspace where every member is a Contributor. Everyone can update budget data, but only the two team leads are on the list of Contributors who can change approval rules and column access. The team moves fast, and the controls stay in trusted hands.
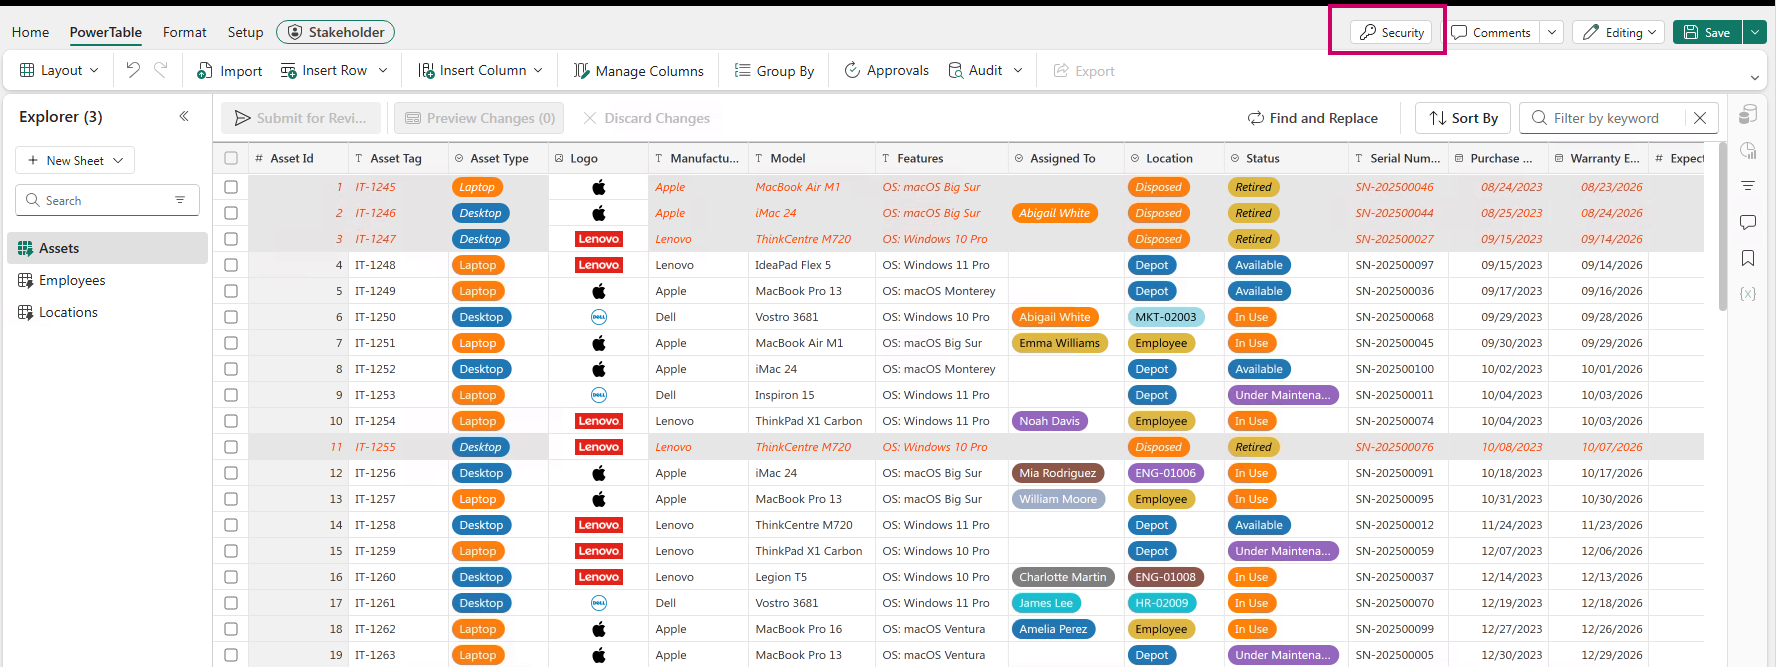
Where to find it: Open Security at the top right of the sheet. Column Access: Security › Column Access. Security access: Security › General › Security access.
Column Access
Security access
Automations and approvals can now post messages to Microsoft Teams channels.
Send a message in a channel is now available as an action in PowerTable automations. It works with Update, Insert, Delete, Insert using Forms and Button triggers. Write the message, then connect to Microsoft Teams and choose the team and channel to post to. Messages can include dynamic content. Insert fields from the record that triggered the automation, such as a task’s name or start date. Or add predefined values, such as the current date and time. Messages are sent with the permissions of the user who triggers the automation.
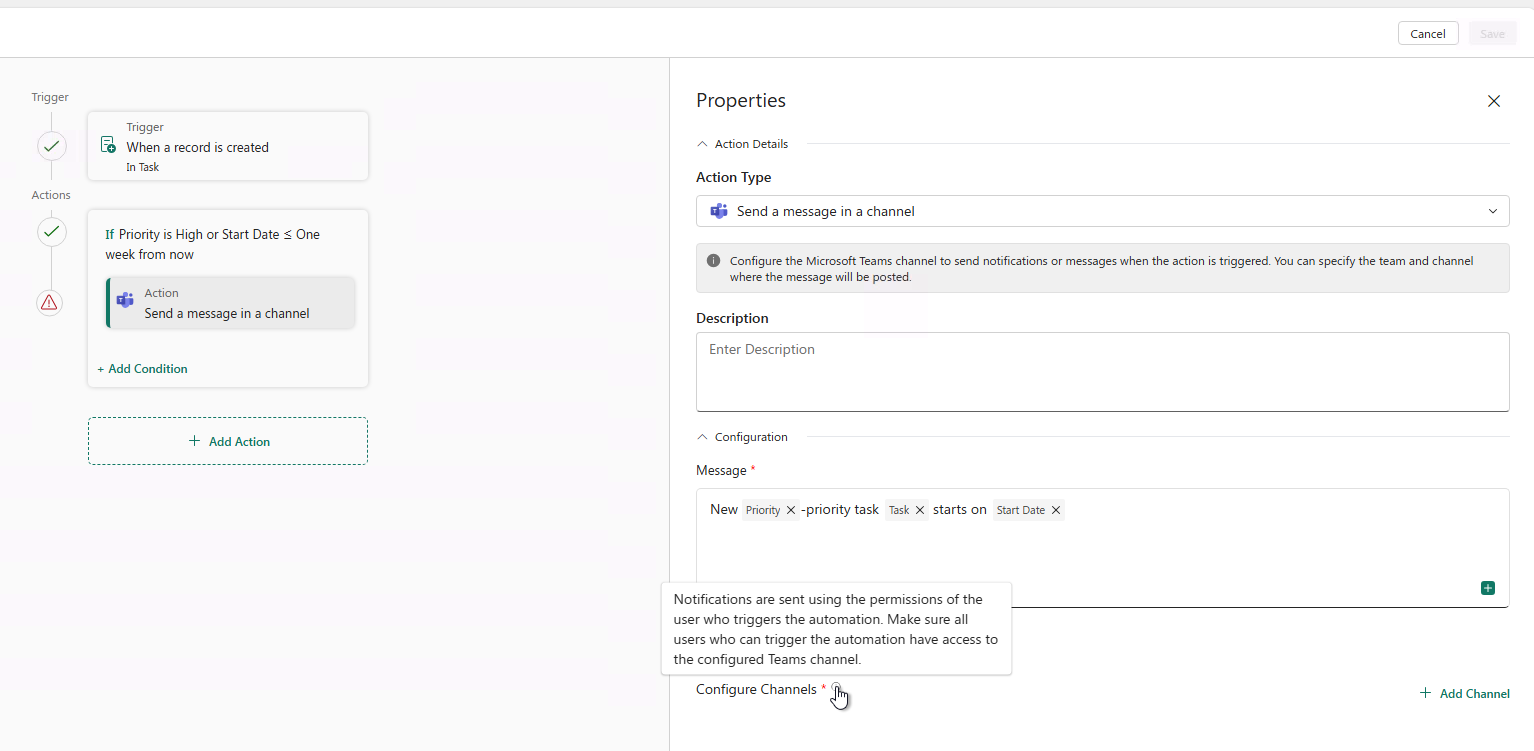
Use case: A high-priority task is created, and the delivery team’s channel hears about it in seconds: “New high-priority task Payment Gateway Integration starts on November 25, 2026.” No one has to refresh a grid or forward an update to keep everyone in the loop.
Approvals can now notify Teams channels in addition to the approvers. In Approvals Configuration, under Notifications, add one or more Teams channels. Each channel is listed with its team and the person who added it, and can be removed at any time.
Use case: A regional manager submits a budget change late in the quarter. The request shows up right away in the finance approvers’ Teams channel, where they’re already working together. Approvals keep moving without anyone digging through an inbox.
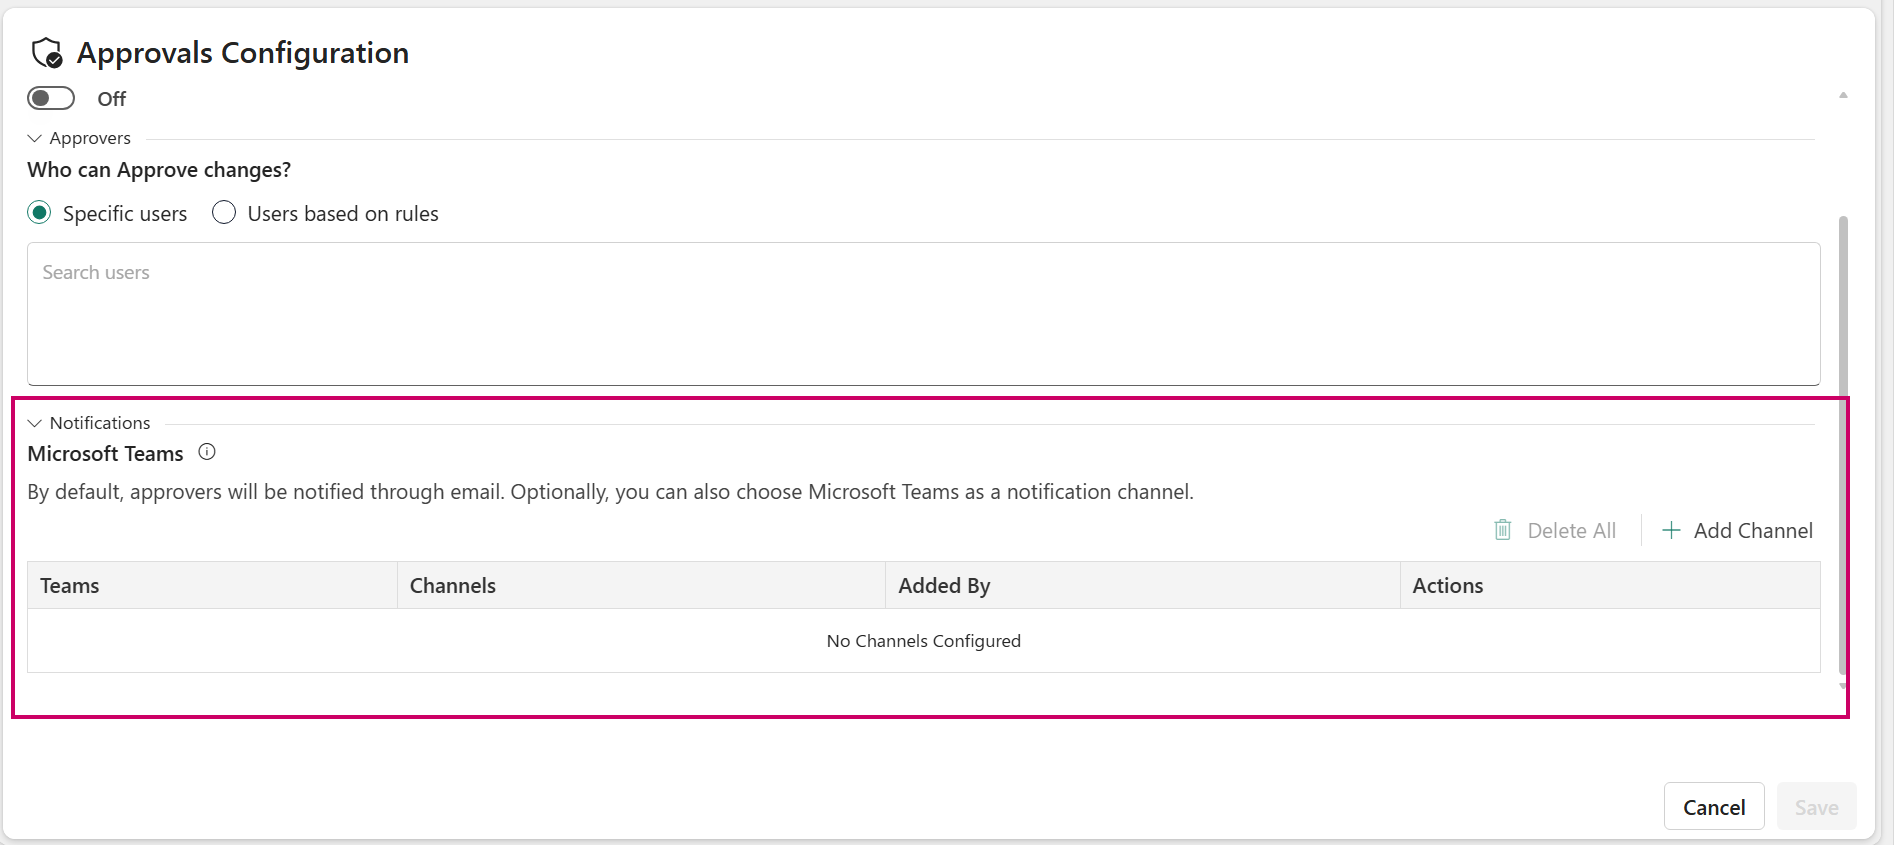
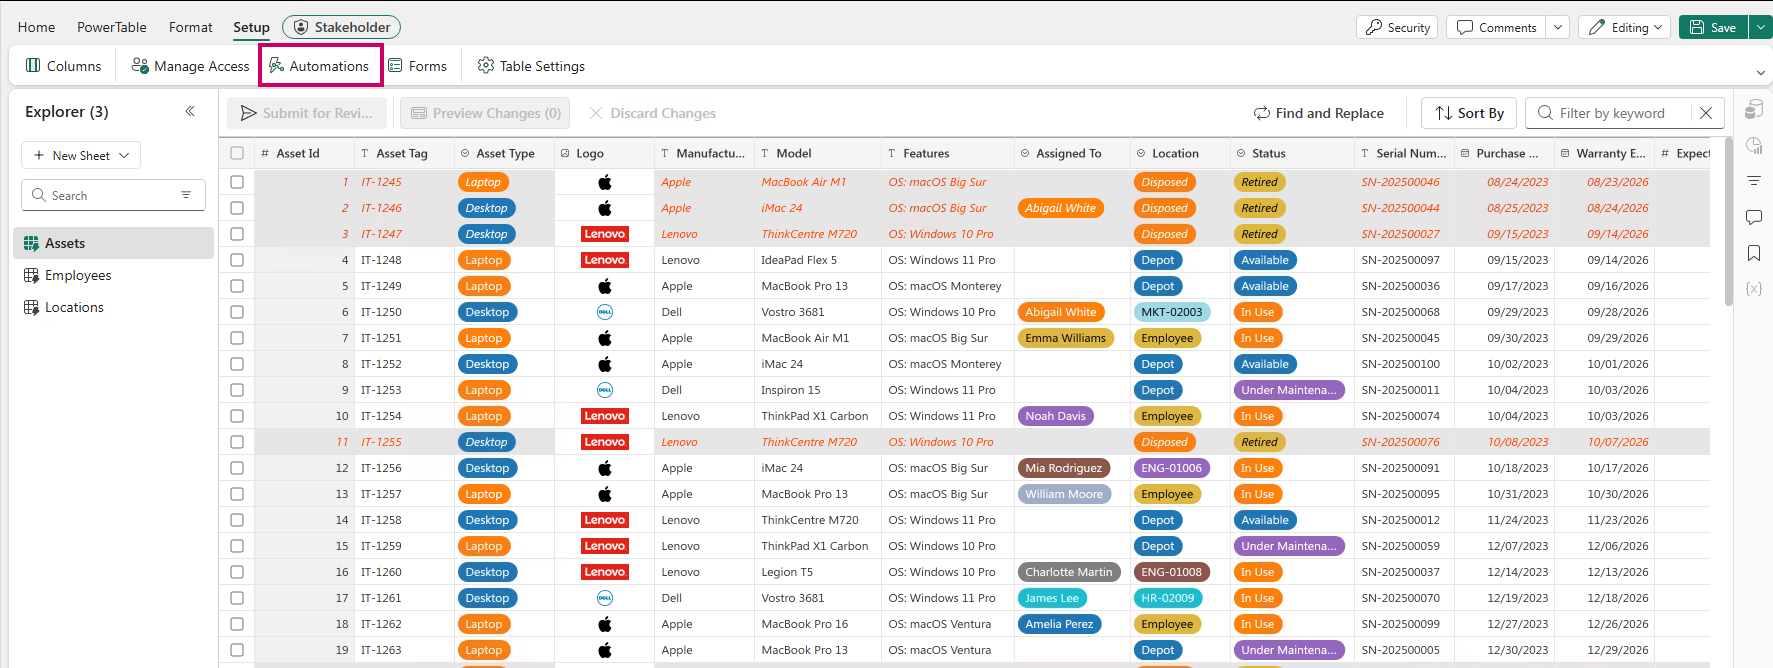
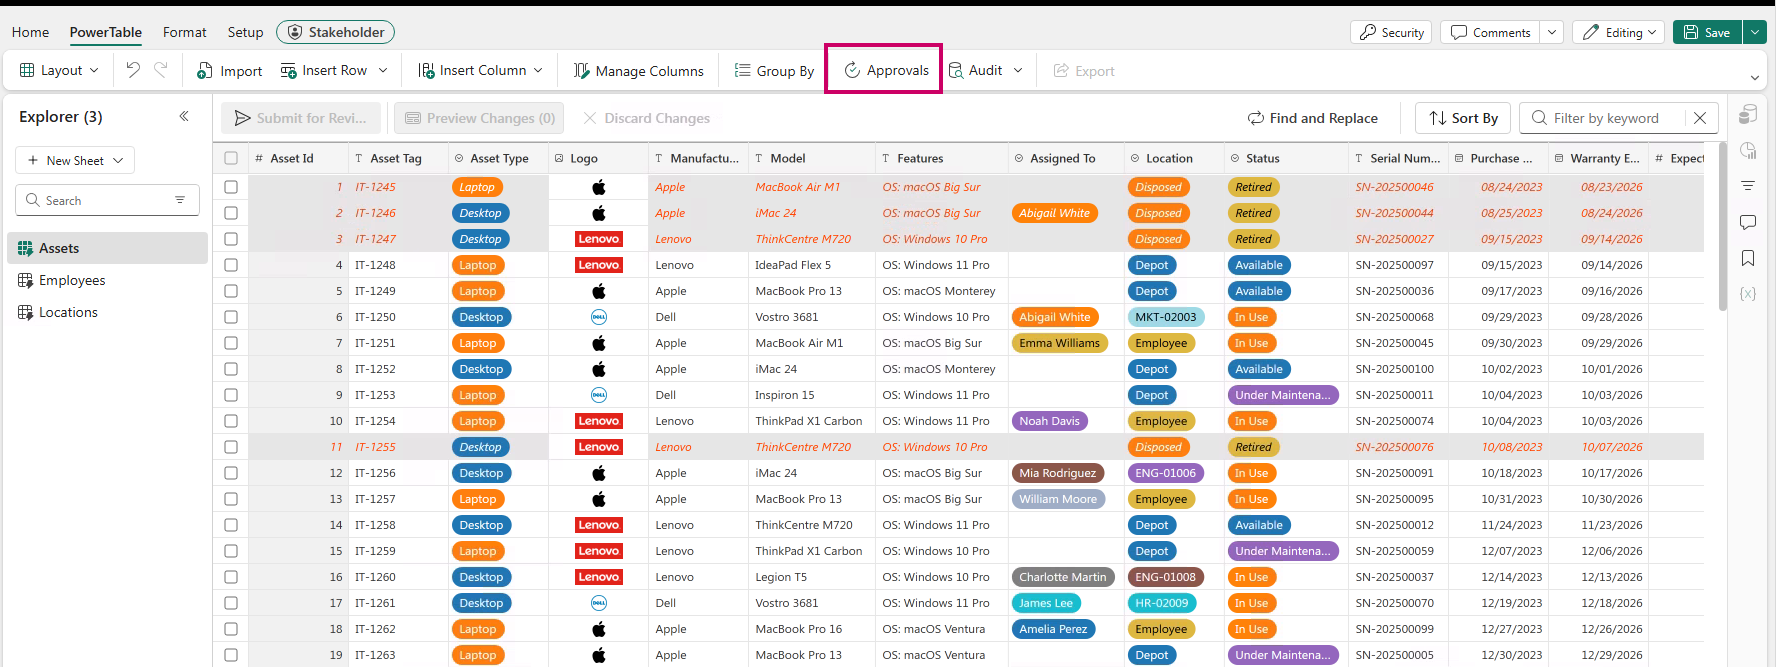
Where to find it: Automations: Setup › Automations. Approvals: PowerTable › Approvals.
Automations
Approvals
The JSON data type lets you store key-value pairs, nested objects and arrays in a single column, and edit them like any other field.
Use cases: Not all business data fits neatly into fixed columns. Now it doesn’t have to. JSON opens PowerTable to semi-structured data in every industry:
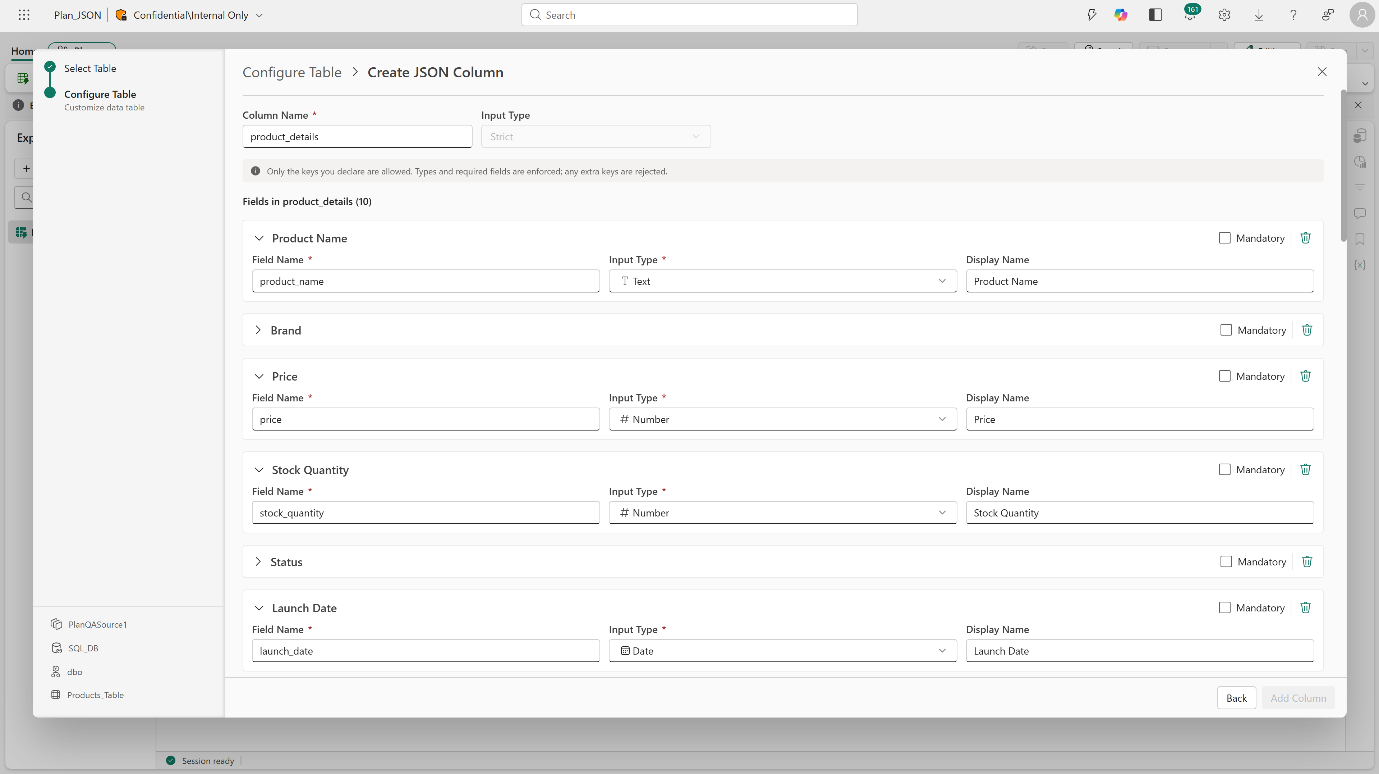
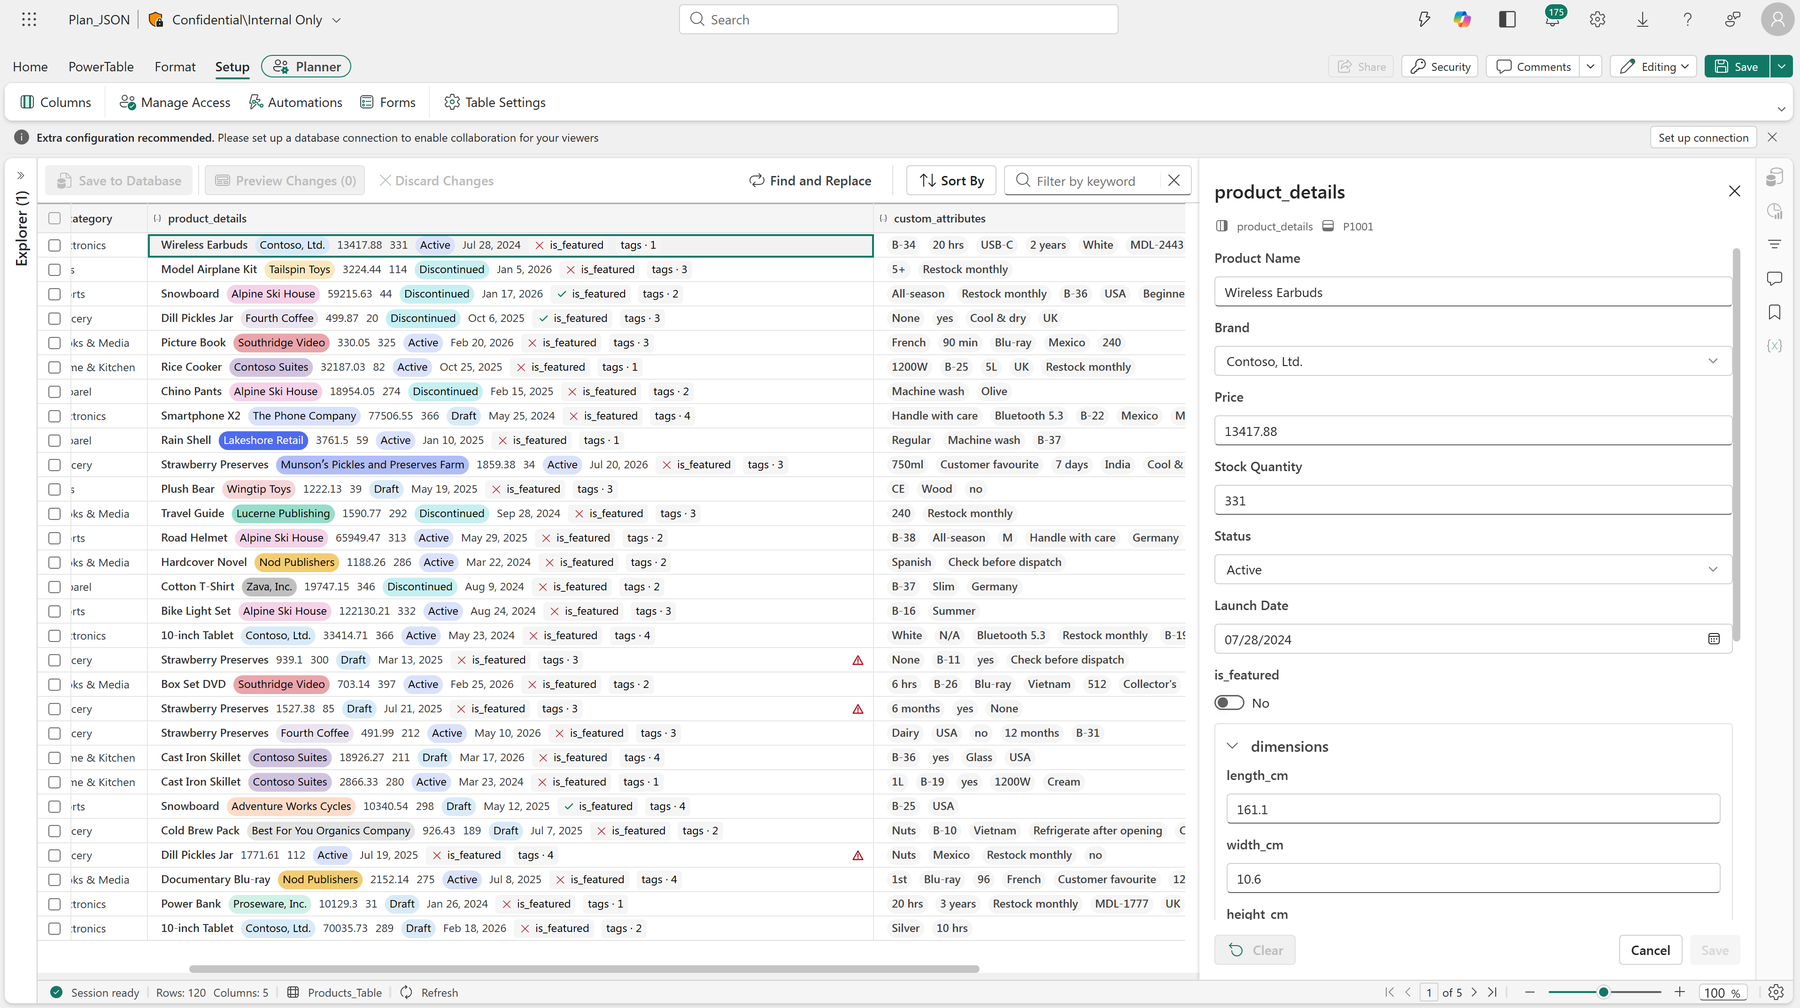
How it works:
Where to find it: For a new column, PowerTable › Insert Column › Database Column. For an existing table, Setup › Columns.
Crosstab displays table data as a pivot. Dimensions sit in Rows and Columns, and the values in the cells are editable. Every change is written back to the source table.
Crosstab now lets you generate the grid you need, enter data at any level of detail, and decide how every value is summarized.
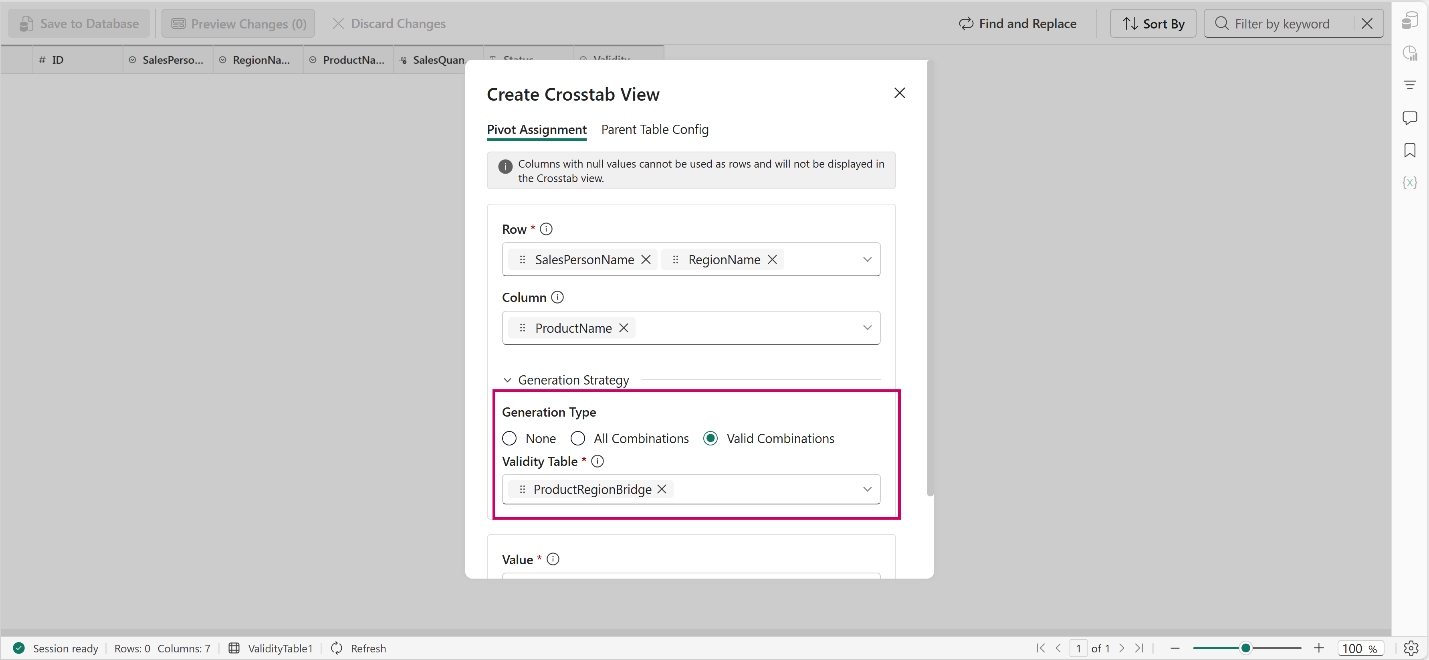
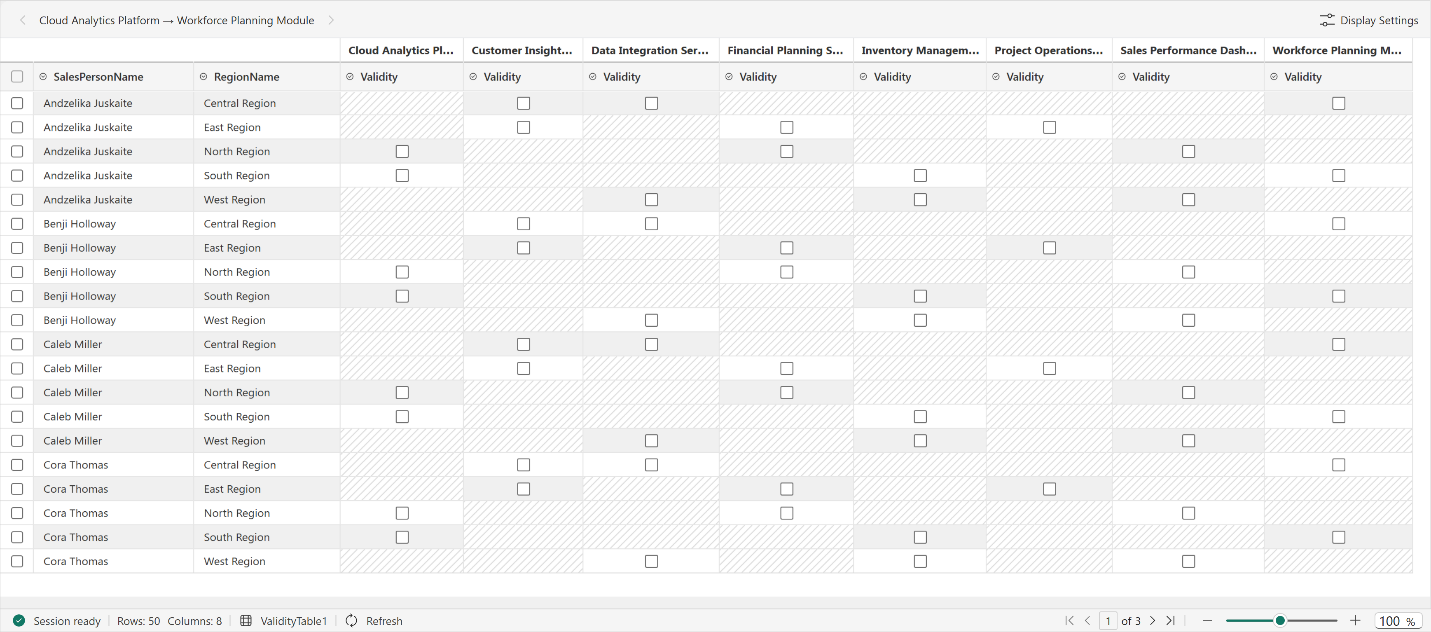
Generation Strategy sets which rows and columns Crosstab creates:
Use case: Picture a sales team planning by product, region and salesperson. Pair a product-region map with a region-salesperson map, and the planning grid builds itself. Every valid combination is ready to fill, and nothing that doesn’t belong gets in the way.
The Columns field accepts multiple dimensions, such as Region, Salesperson and Month. Their order sets the header hierarchy. Date, single-select and lookup fields can be combined.
Use case: A sales director reviews targets across the whole organization. With Region, Salesperson and Month stacked in Columns, every salesperson in every region appears side by side, month by month, in one view. No more stitching reports together to see how the team is tracking.
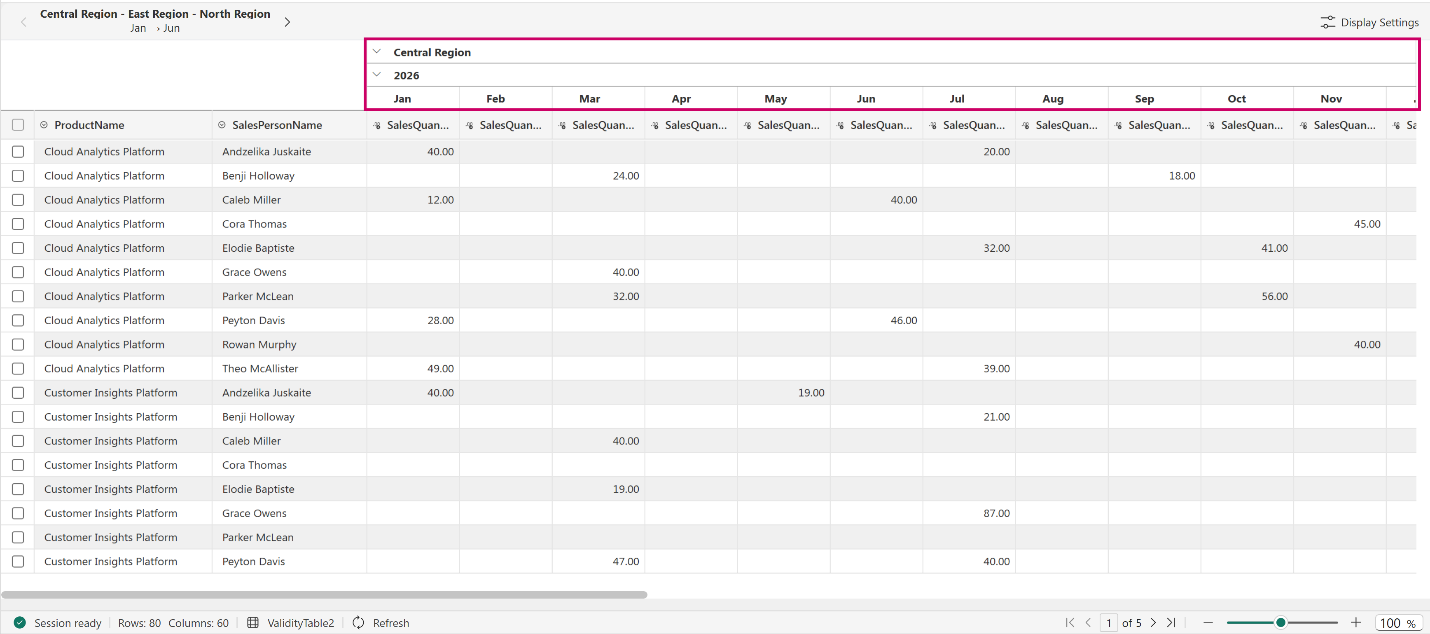
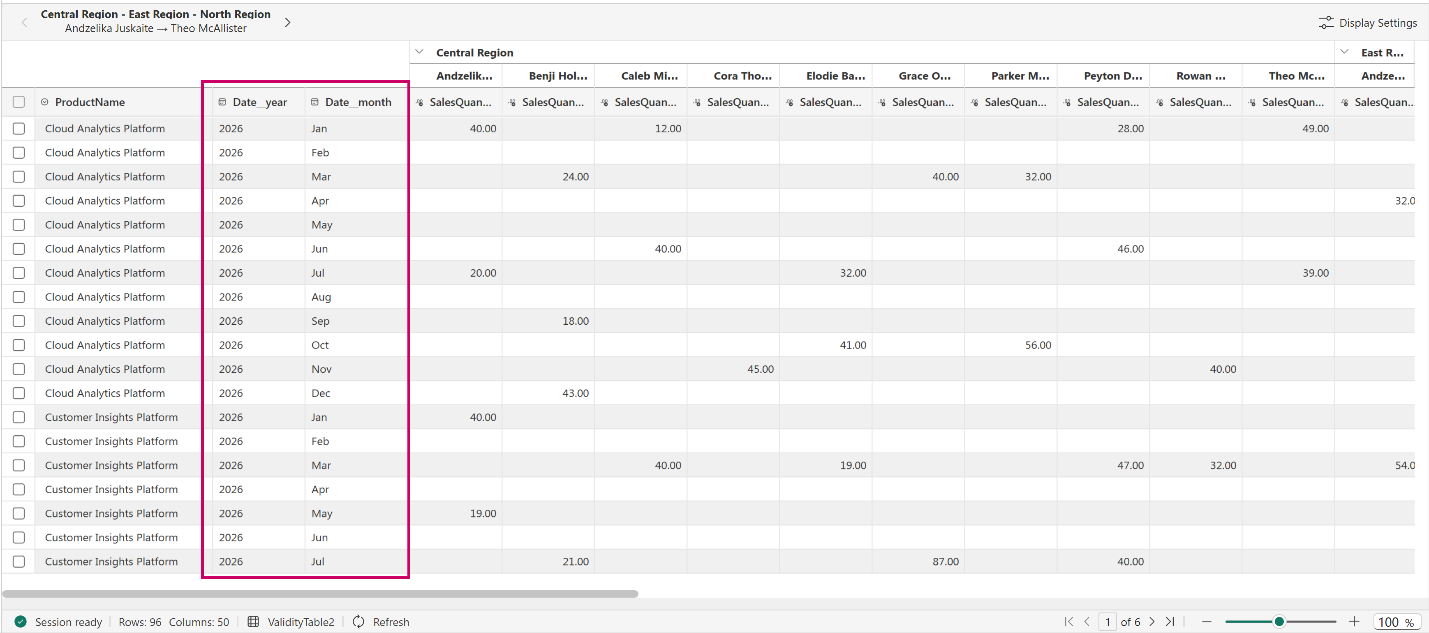
Date fields can now be added to Rows. They use the same Time Interval, Date Range and Date Hierarchy settings as in Columns. Crosstab generates a row for each period in the range, and can add Year and Quarter columns from the hierarchy.
Use case: A product planner builds a monthly forecast with months down the side and regions across the top. The year and quarter stay in view next to every month, so seasonal patterns are easy to spot. Forecasting feels as easy as a spreadsheet, with every number saved straight to the source.
A Crosstab can be configured with only Rows and Values, without a Column dimension. Generation, aggregation and subtotals work the same way.
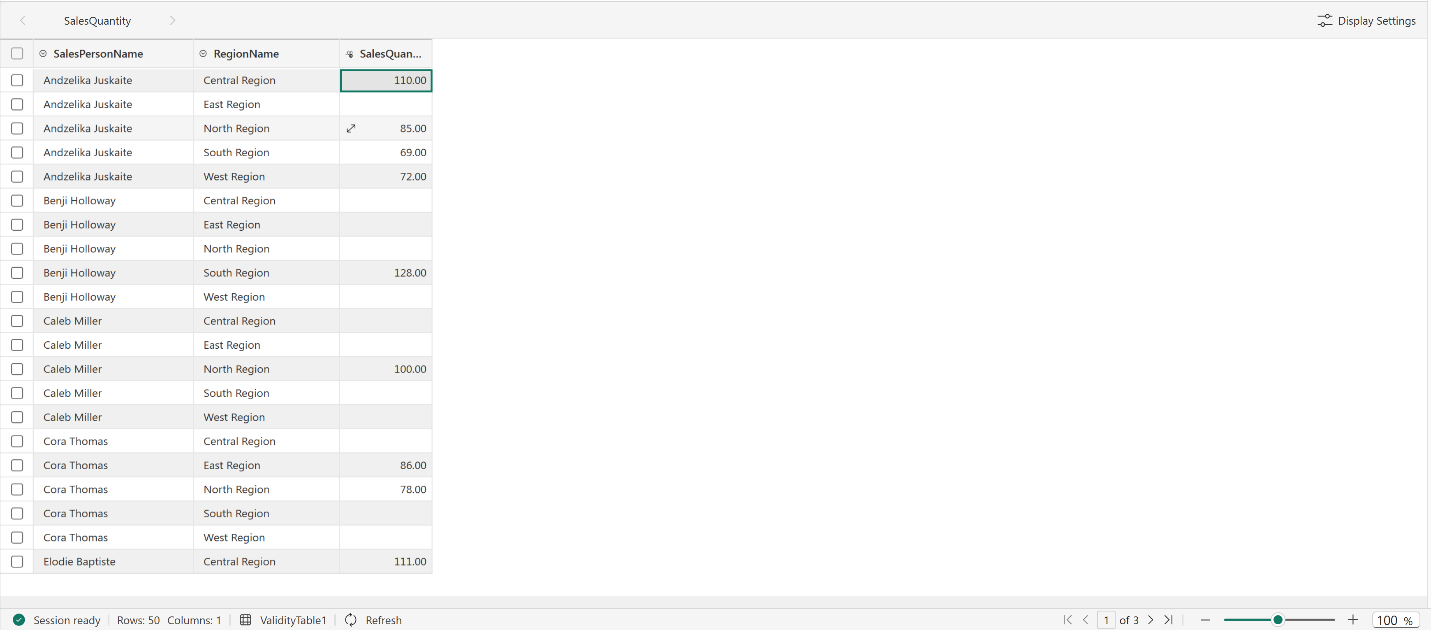
Use case: A finance team collects budget lines by department and cost center. A row-only Crosstab gives them a clean list to fill in, with subtotals for each department rolling up on their own. No extra columns and no manual totals.
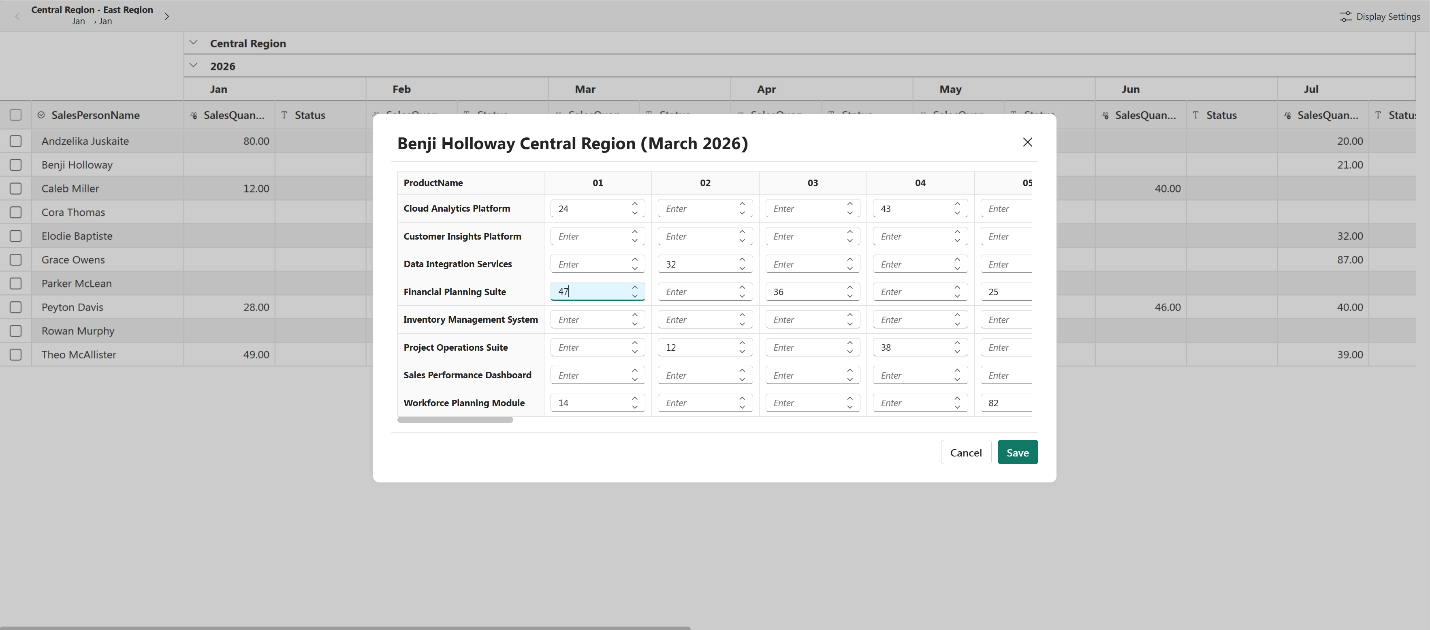
With Drilldown on, selecting a cell opens a detail view of the values behind it. Drill by field, such as Task under Project. Or drill by time, such as Week or Day under Month. Values entered in the detail view are written to the matching record and date. With Drilldown off, a Period Reference Date sets which date each summary value is read from and written to. Choose First Day, Last Day or a specific day.
Use case: A project manager reviews logged hours by project and month. When a month looks light, they open the cell and enter hours week by week, task by task. The big picture and the fine detail stay one click apart, and every value lands on the right record and date.
Each field in Values has its own aggregation, set from its ellipsis menu. Number fields support Sum, Average, Minimum, Maximum, Count and Count Distinct. Text and date fields support First, Last, Count and Count Distinct. Binary fields support Count and Count Distinct. The aggregation applies to subtotals, grand totals, drilldowns and collapsed column groups.
Use case: A delivery lead tracks hours and status for every task in one Crosstab. Hours are summed for each period, while Status shows the latest value, so effort and progress sit side by side. Every number tells the story it should.
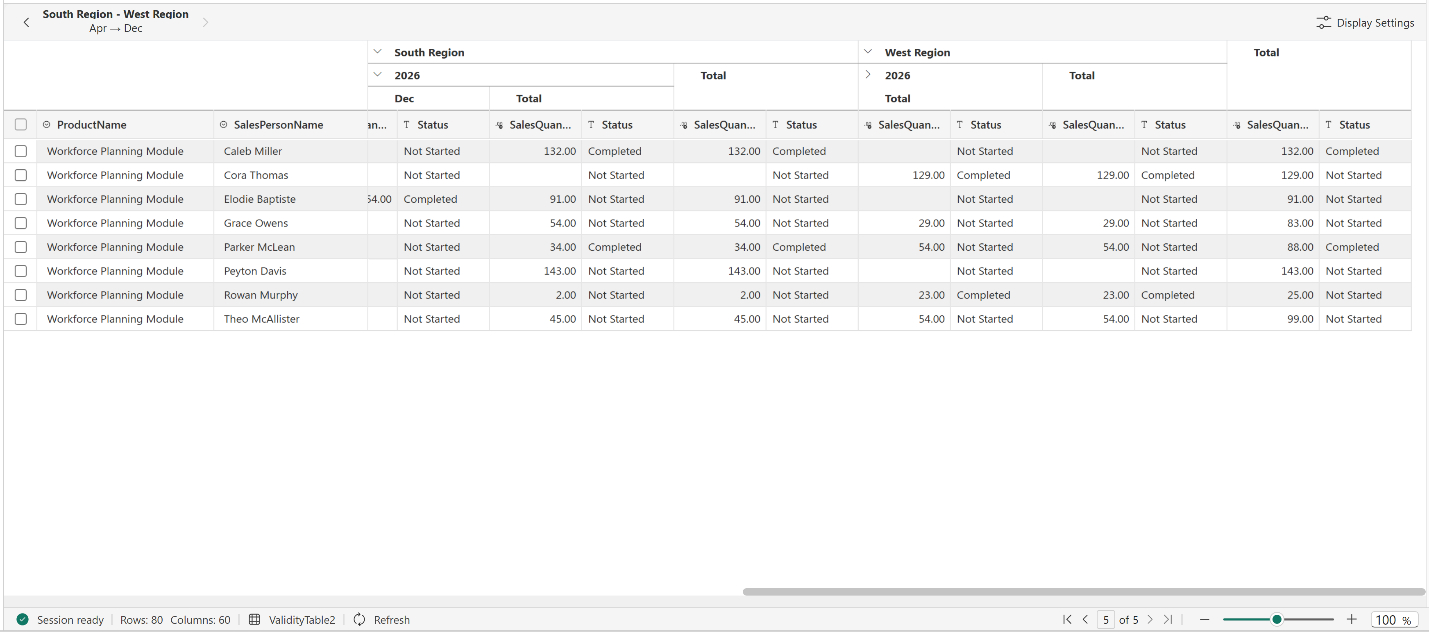
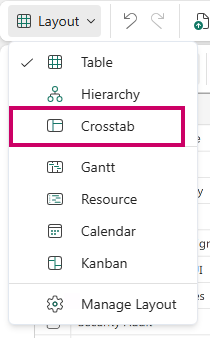
Where to find it: PowerTable › Layout › Crosstab. To change an existing Crosstab, PowerTable › Layout › Manage Layout.
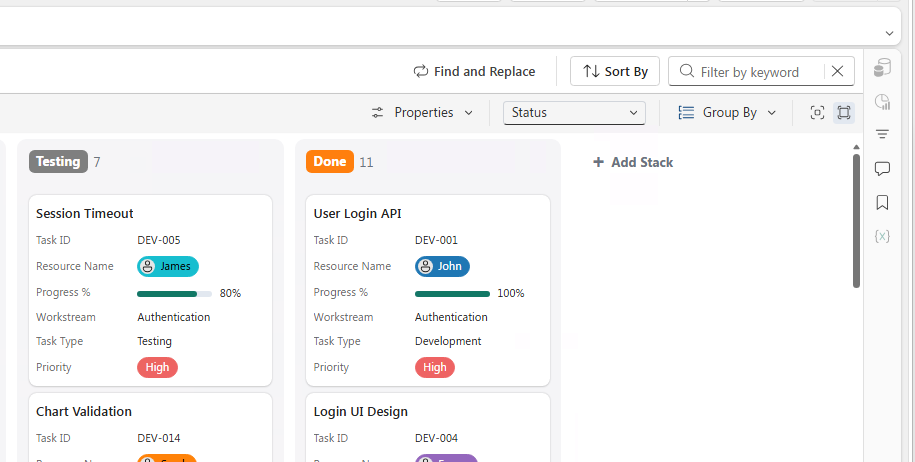
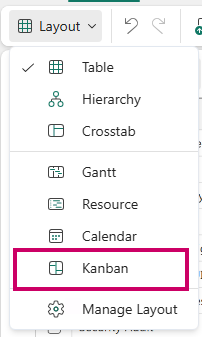
Kanban groups table rows into stacks by a status column. Moving a card to another stack updates its status.
Kanban now lets you set a limit on each stage and add new stages without leaving the board.
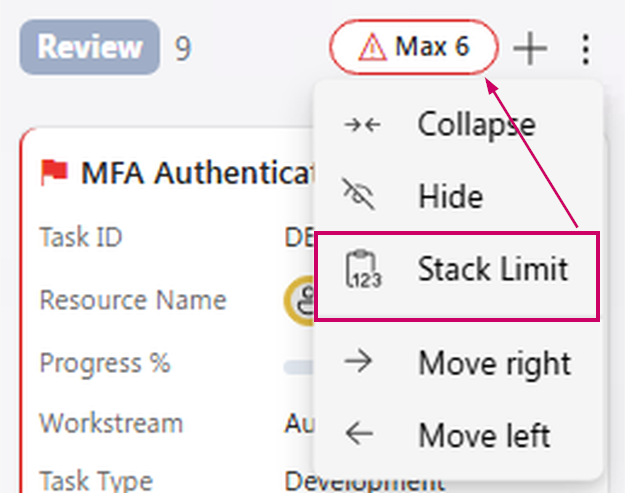
Stack Limit, in each stack’s menu, sets the maximum number of cards a stack can hold. It works for any stack, whether the board is grouped by stage, owner, priority or any other column. The header shows the current count against the limit. A red Max marker appears when the count goes over it. Each stack can have its own limit, or none.
Use case: A development team caps its Review stack at six cards. When a seventh card lands, the Max marker appears on the header, and the team knows it’s time to finish reviews before starting anything new. Bottlenecks show up before they become problems.
The + Add Stack button sits after the last stack. The name is added as a new value of the status column. Cards moved into the stack take that value when saved.
Use case: Work on an integration stalls while the team waits on a vendor. The team lead adds a Blocked stage straight from the board and moves the affected cards into it. Everyone can see what’s stuck, and the board stays an honest picture of the work.
Where to find it: PowerTable › Layout › Kanban.
Stack limits
New stages
Earned Value Management lets you see whether a project is on schedule and on budget, in the same plan your team works in.
Earned Value Management (EVM) is the standard project control method for tracking schedule and cost together. It complements your Gantt schedule by showing whether spending is in line with progress. EVM compares three figures against an approved baseline. These are the budgeted value of work planned to date, the budgeted value of work completed, and the actual cost so far.
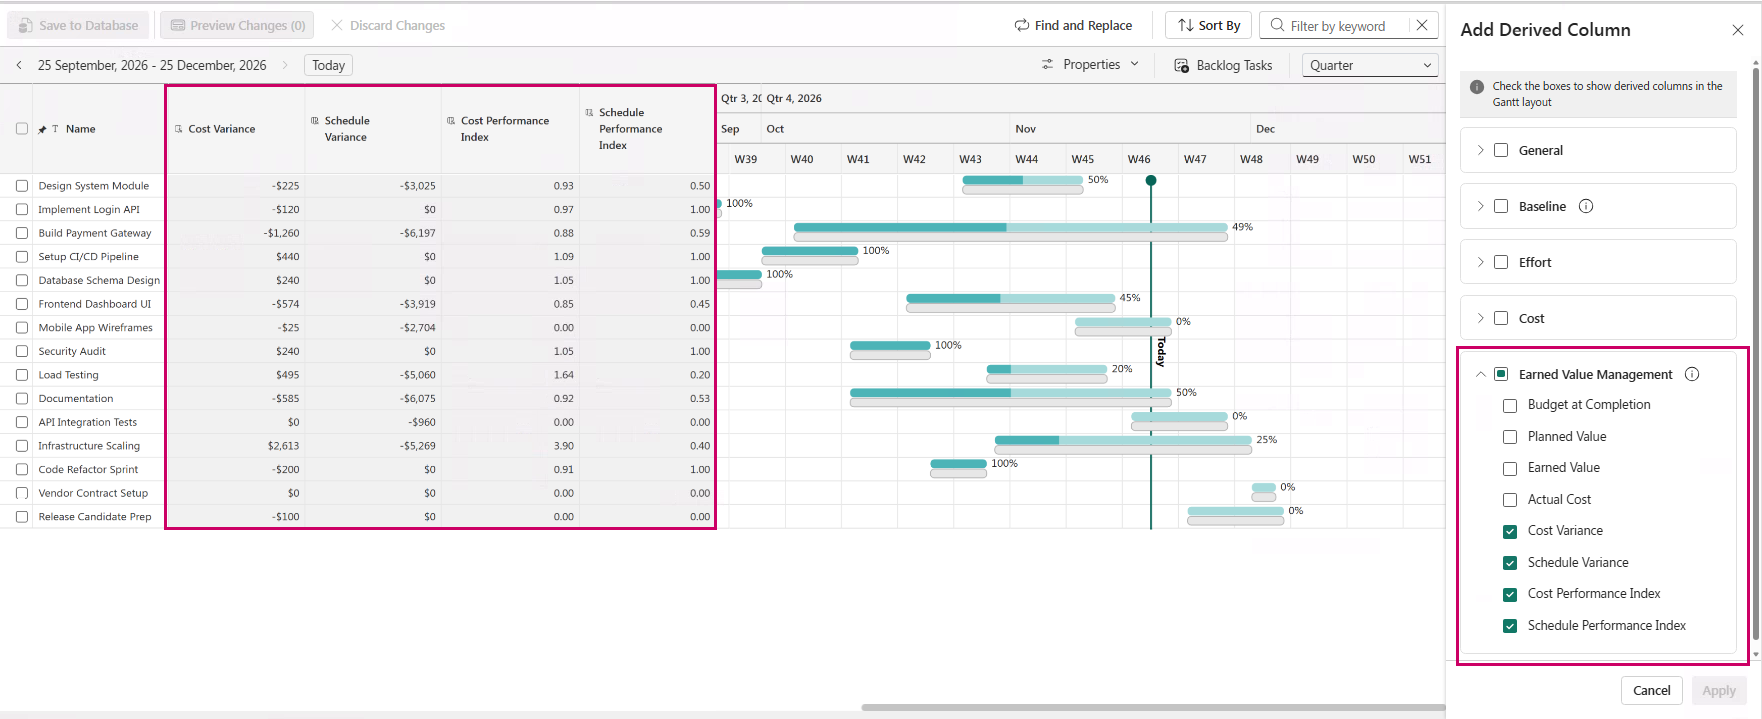
PowerTable now calculates EVM on your project plans. Inputs from your task, resource and time-entry tables are mapped once in Layout Configuration. PowerTable then calculates Budget at Completion, which is locked when you save a baseline. It also calculates Planned Value, Earned Value, Actual Cost, Schedule Variance, Cost Variance, Schedule Performance Index (SPI) and Cost Performance Index (CPI). Variances show how far ahead or behind a project is in money terms. An SPI or CPI below 1.0 means the project is behind schedule or over budget.
Use case: Take a $100K project with an SPI of 0.88 and a CPI of 0.78. An SPI of 0.88 means the team has completed 12% less work than scheduled so far. A CPI of 0.78 means every dollar spent is earning 78 cents of budgeted work. Your PMO knows while there’s still time to act.
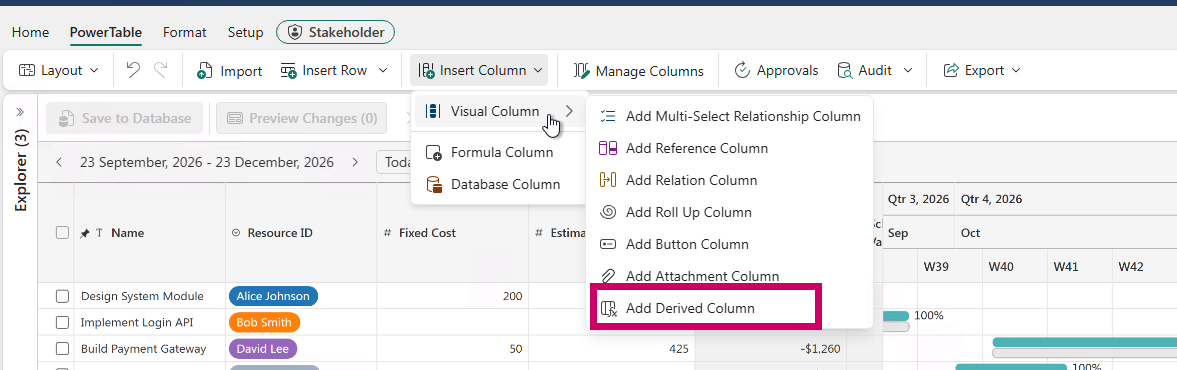
Where to find it: On a Gantt layout, PowerTable › Insert Column › Visual Column › Add Derived Column.
This release helps teams spend less time wrangling data and more time acting on it. Because it all runs on your Fabric data, everything stays in one governed place.
Start with the update closest to a challenge your team has today: a sensitive column, a product table full of empty cells, or a board that’s always overloaded. Turn it on, and see what changes.
Secure data, flexible structure and plans that build themselves, all in the place your teams already work.
Feature details reflect Fabric Plan at the time of writing.
PowerTable sheets in Fabric Plan, is a no-code data app for managing dimensions, master and reference data, and business entities, stored and governed in Fabric SQL tables.
Here's a roundup of the latest updates, covering security, automation, data entry, tracking and everyday usability.
Protect sensitive data with security that builds in layers. Access starts at the database and narrows further in PowerTable, with flexible rules that adapt to how each organization defines who should see what.
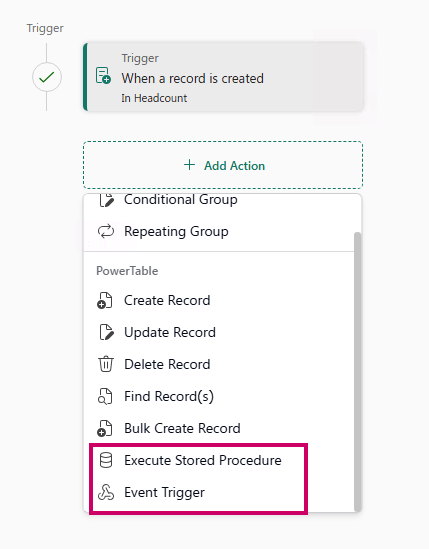
Let every change set the next one in motion. New automation actions use the data entered in PowerTable to trigger further updates across Fabric items and databases, keeping connected systems in sync without manual effort:
More data, more ease to bring it in. PowerTable now provides greater flexibility at the point of entry:
PowerTable now exposes more metrics and perspectives, making effort and workload easier to track:
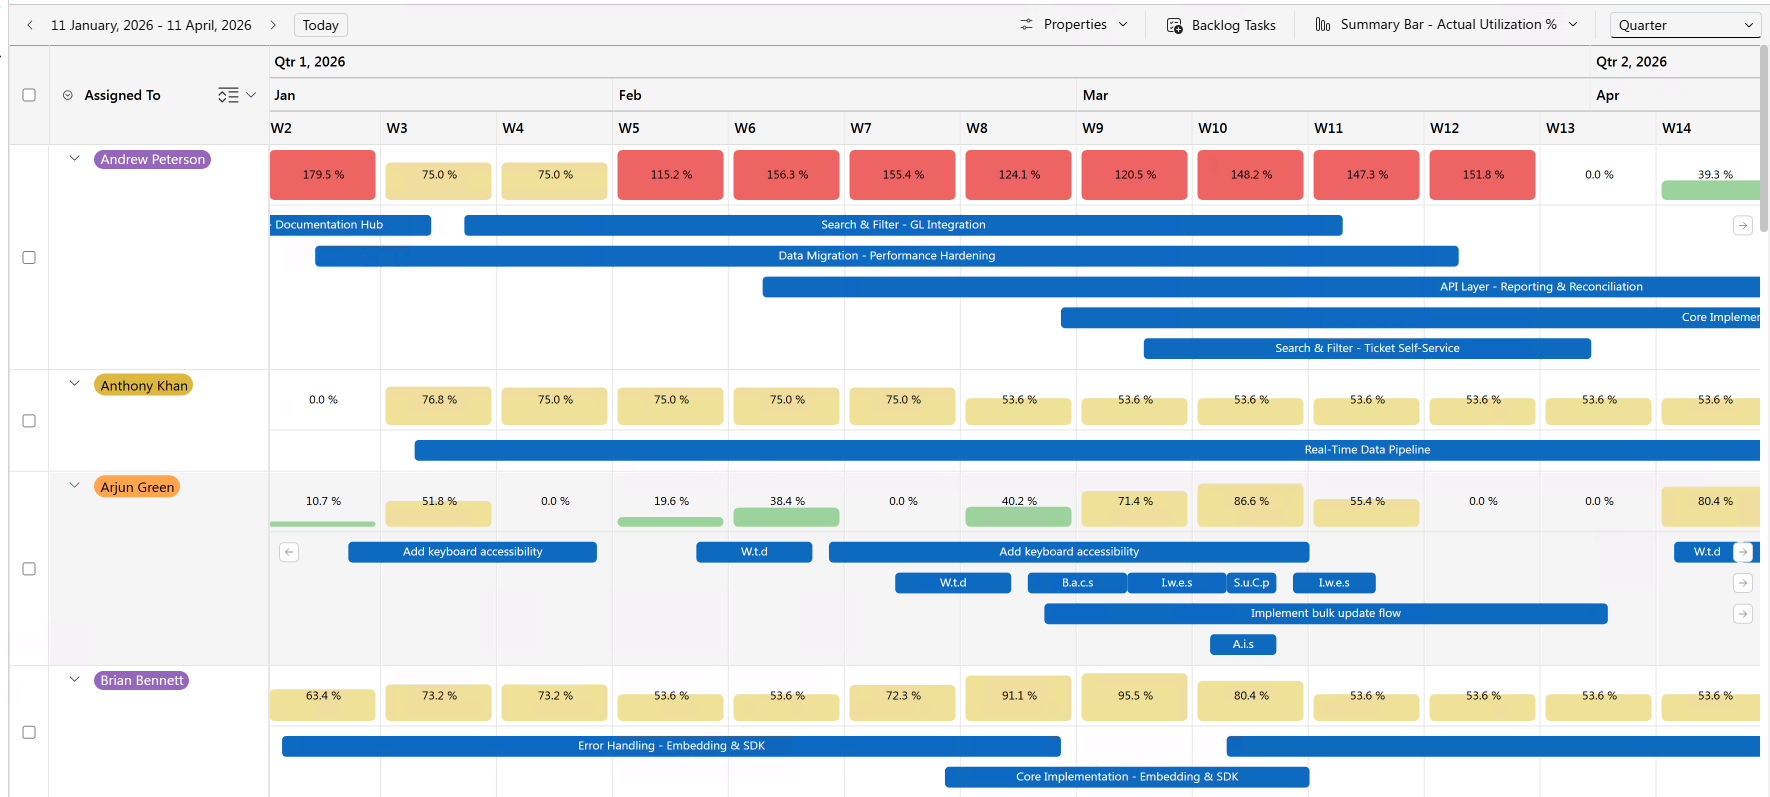
The most common scheduling and restructuring actions are now right where you work:
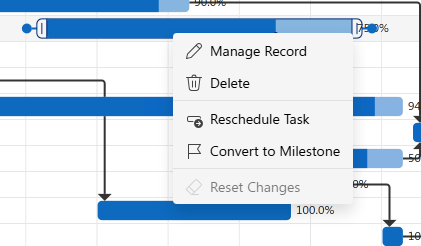
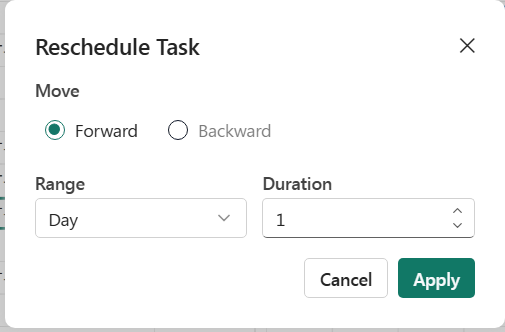
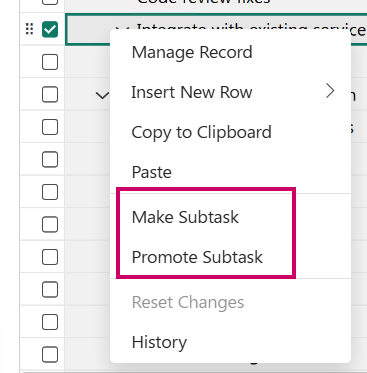
In the pursuit of a more intuitive, personalized and collaborative experience, PowerTable now includes the following updates:
That's the latest from PowerTable. Grab a table, try something new, and watch this space for what's next.