

Lumel
Introducing Consolidation Templates for Row Models in Microsoft Fabric Plan
Fabric PlanningFP&A
Available now for all Plan items. Anchoring Measures does not require the Native Planning Engine; it works with both the Native Planning Engine and the previous planning engine.
A product’s unit price belongs beside the product. A regional assumption belongs where the regional team maintains it. An executive profitability metric belongs in the summary where leaders review it.
But add those measures to a hierarchical grid, and they can appear everywhere: at region totals, category subtotals, individual SKUs, and every expanded period. The grid treats them alike even though they serve different business purposes.
Anchoring Measures in Fabric Plan lets you choose the row and column levels where each measure belongs. It works with Power BI Measures, input measures created in the plan, and formula measures created in the plan. For input measures, the anchor also defines where users can enter values directly.
You can build one view that shows product details, business assumptions, and executive results at their appropriate levels, with fewer repeated measures to navigate.
Imagine a retailer planning across Region → Category → SKU, with Year → Quarter → Month on columns. The plan includes quantity, unit price, standard unit cost, price uplift, revenue, and EBITDA margin.
Those measures answer different questions. A planner needs quantity at SKU and month. A pricing team maintains an annual uplift by region. Leadership reviews quarterly EBITDA margin by region. A price displayed at the regional subtotal may be technically calculated by the model, but it is not the product price the planner needs.
Without control over placement, teams often accept a cluttered grid, build separate summary and detail reports, or maintain assumptions in a separate spreadsheet block connected to the plan by formulas. Users must remember which repeated values are meaningful and which cells they should update.
Anchoring makes that intent part of the grid configuration. Here are three realistic ways it helps.
A retailer sells two products with centrally maintained prices and standard costs:
| Product SKU | List price per unit | Standard cost per unit |
|---|---|---|
| Travel Mug TM100 | $24 | $9 |
| Water Bottle WB200 | $32 | $12 |
In this example, each SKU’s list price and standard cost are the same across regions. These are Power BI Measures from the Power BI semantic model.
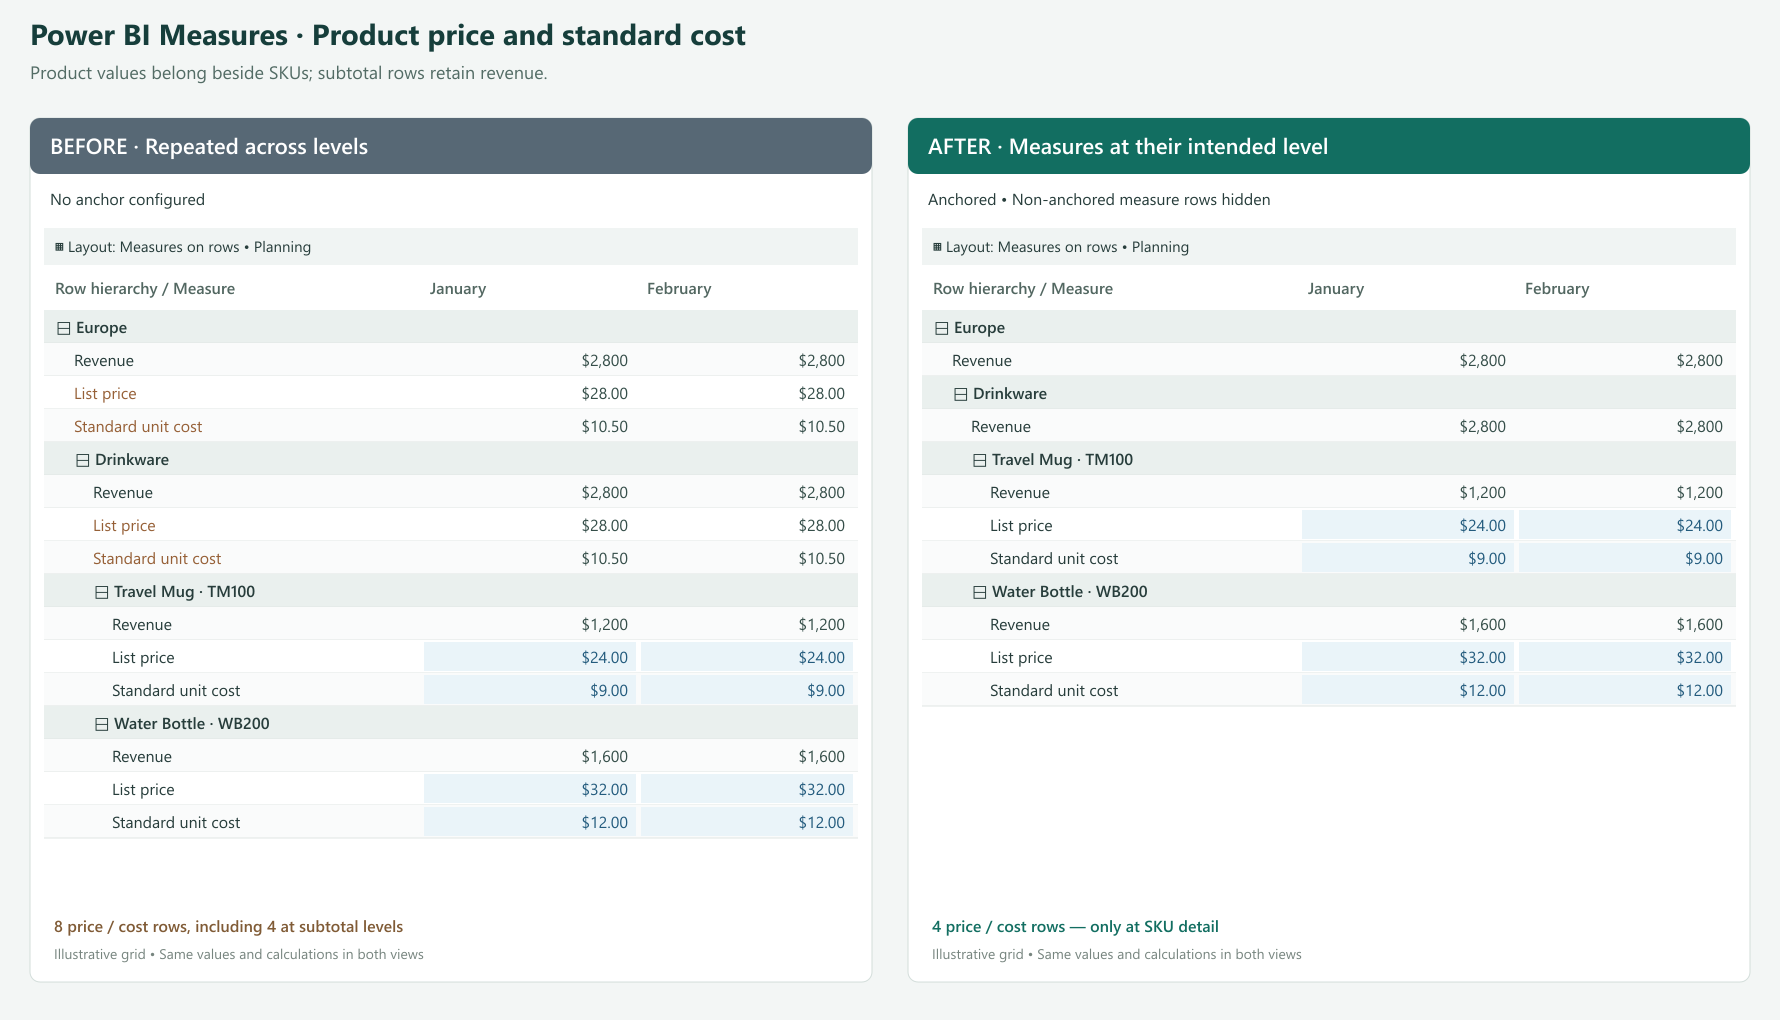
When the measures repeat throughout the hierarchy, the grid also presents them at Category and Region subtotals. Whether the underlying measure returns an average, another aggregate, or a blank, that placement distracts from the intended question: What is the price or cost of this SKU? A regional subtotal is not another product with its own list price.
Teams may work around this with a separate product reference report or special display logic in their measures. That adds maintenance just to control where a number appears.
Anchor List Price and Standard Unit Cost to the SKU level. Users see those measures at product detail, while Region and Category subtotals focus on totals such as quantity, revenue, and gross profit. Hide the non-anchored instances to remove those price and cost measures from the subtotal levels.
The SKU’s $24 price still comes from the Power BI measure. Anchoring controls its placement; it does not force prices to be identical across regions or alter the DAX calculation. The shared regional price is already a rule of this example’s semantic model.
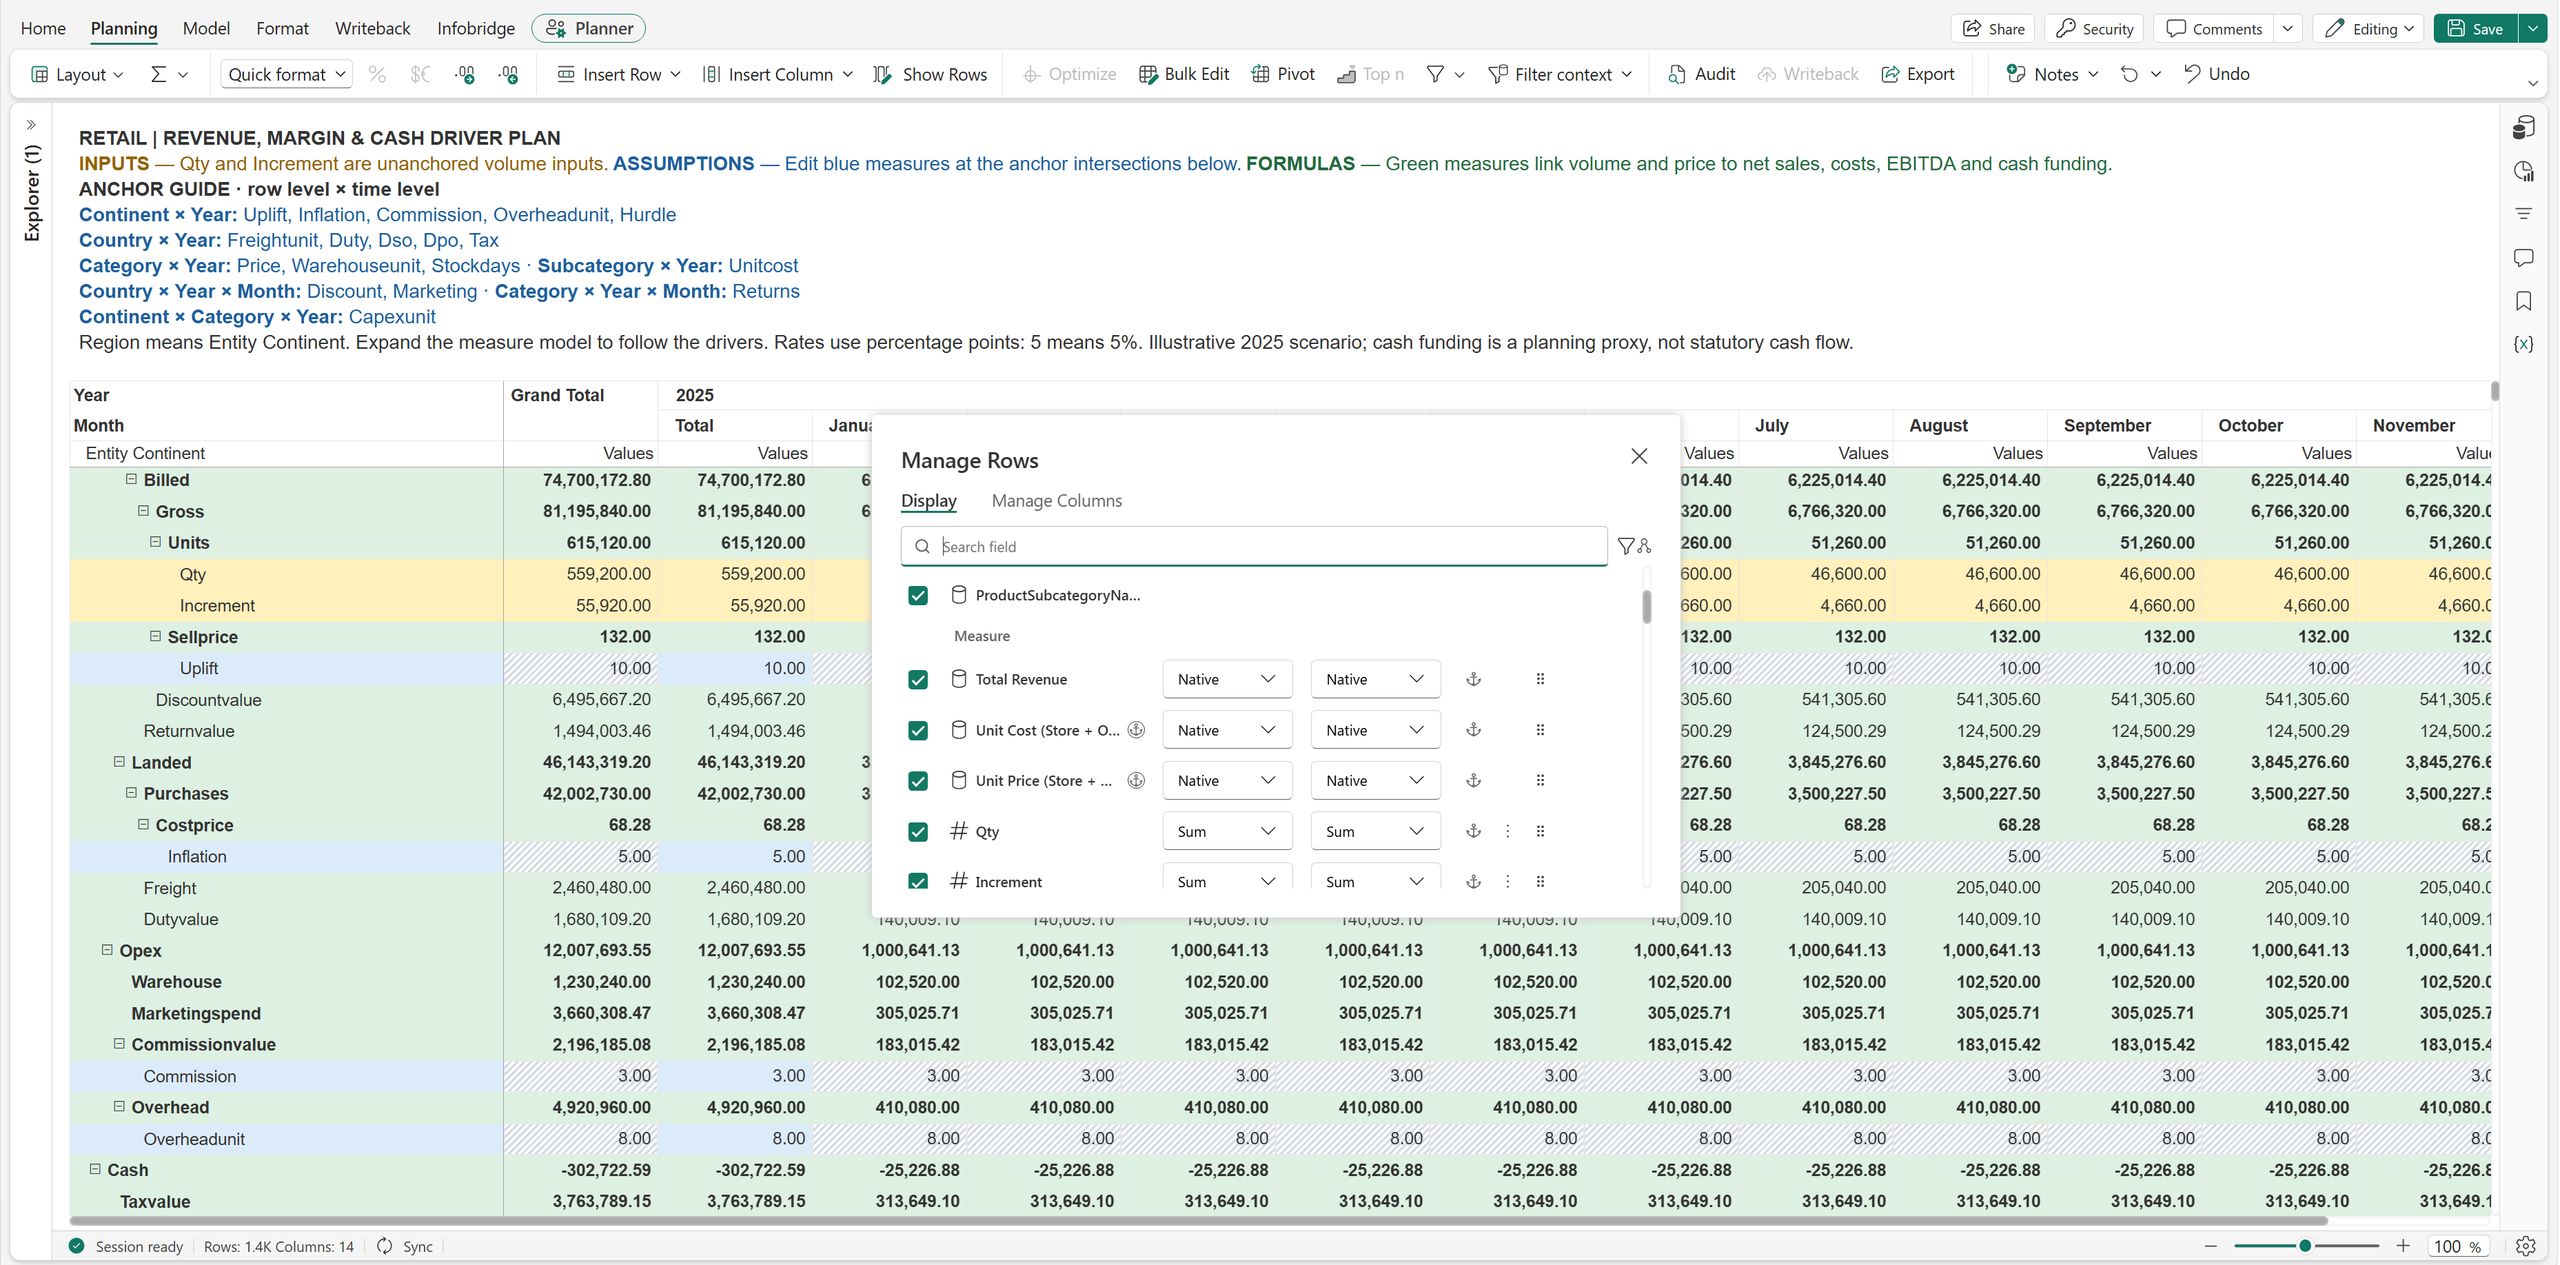
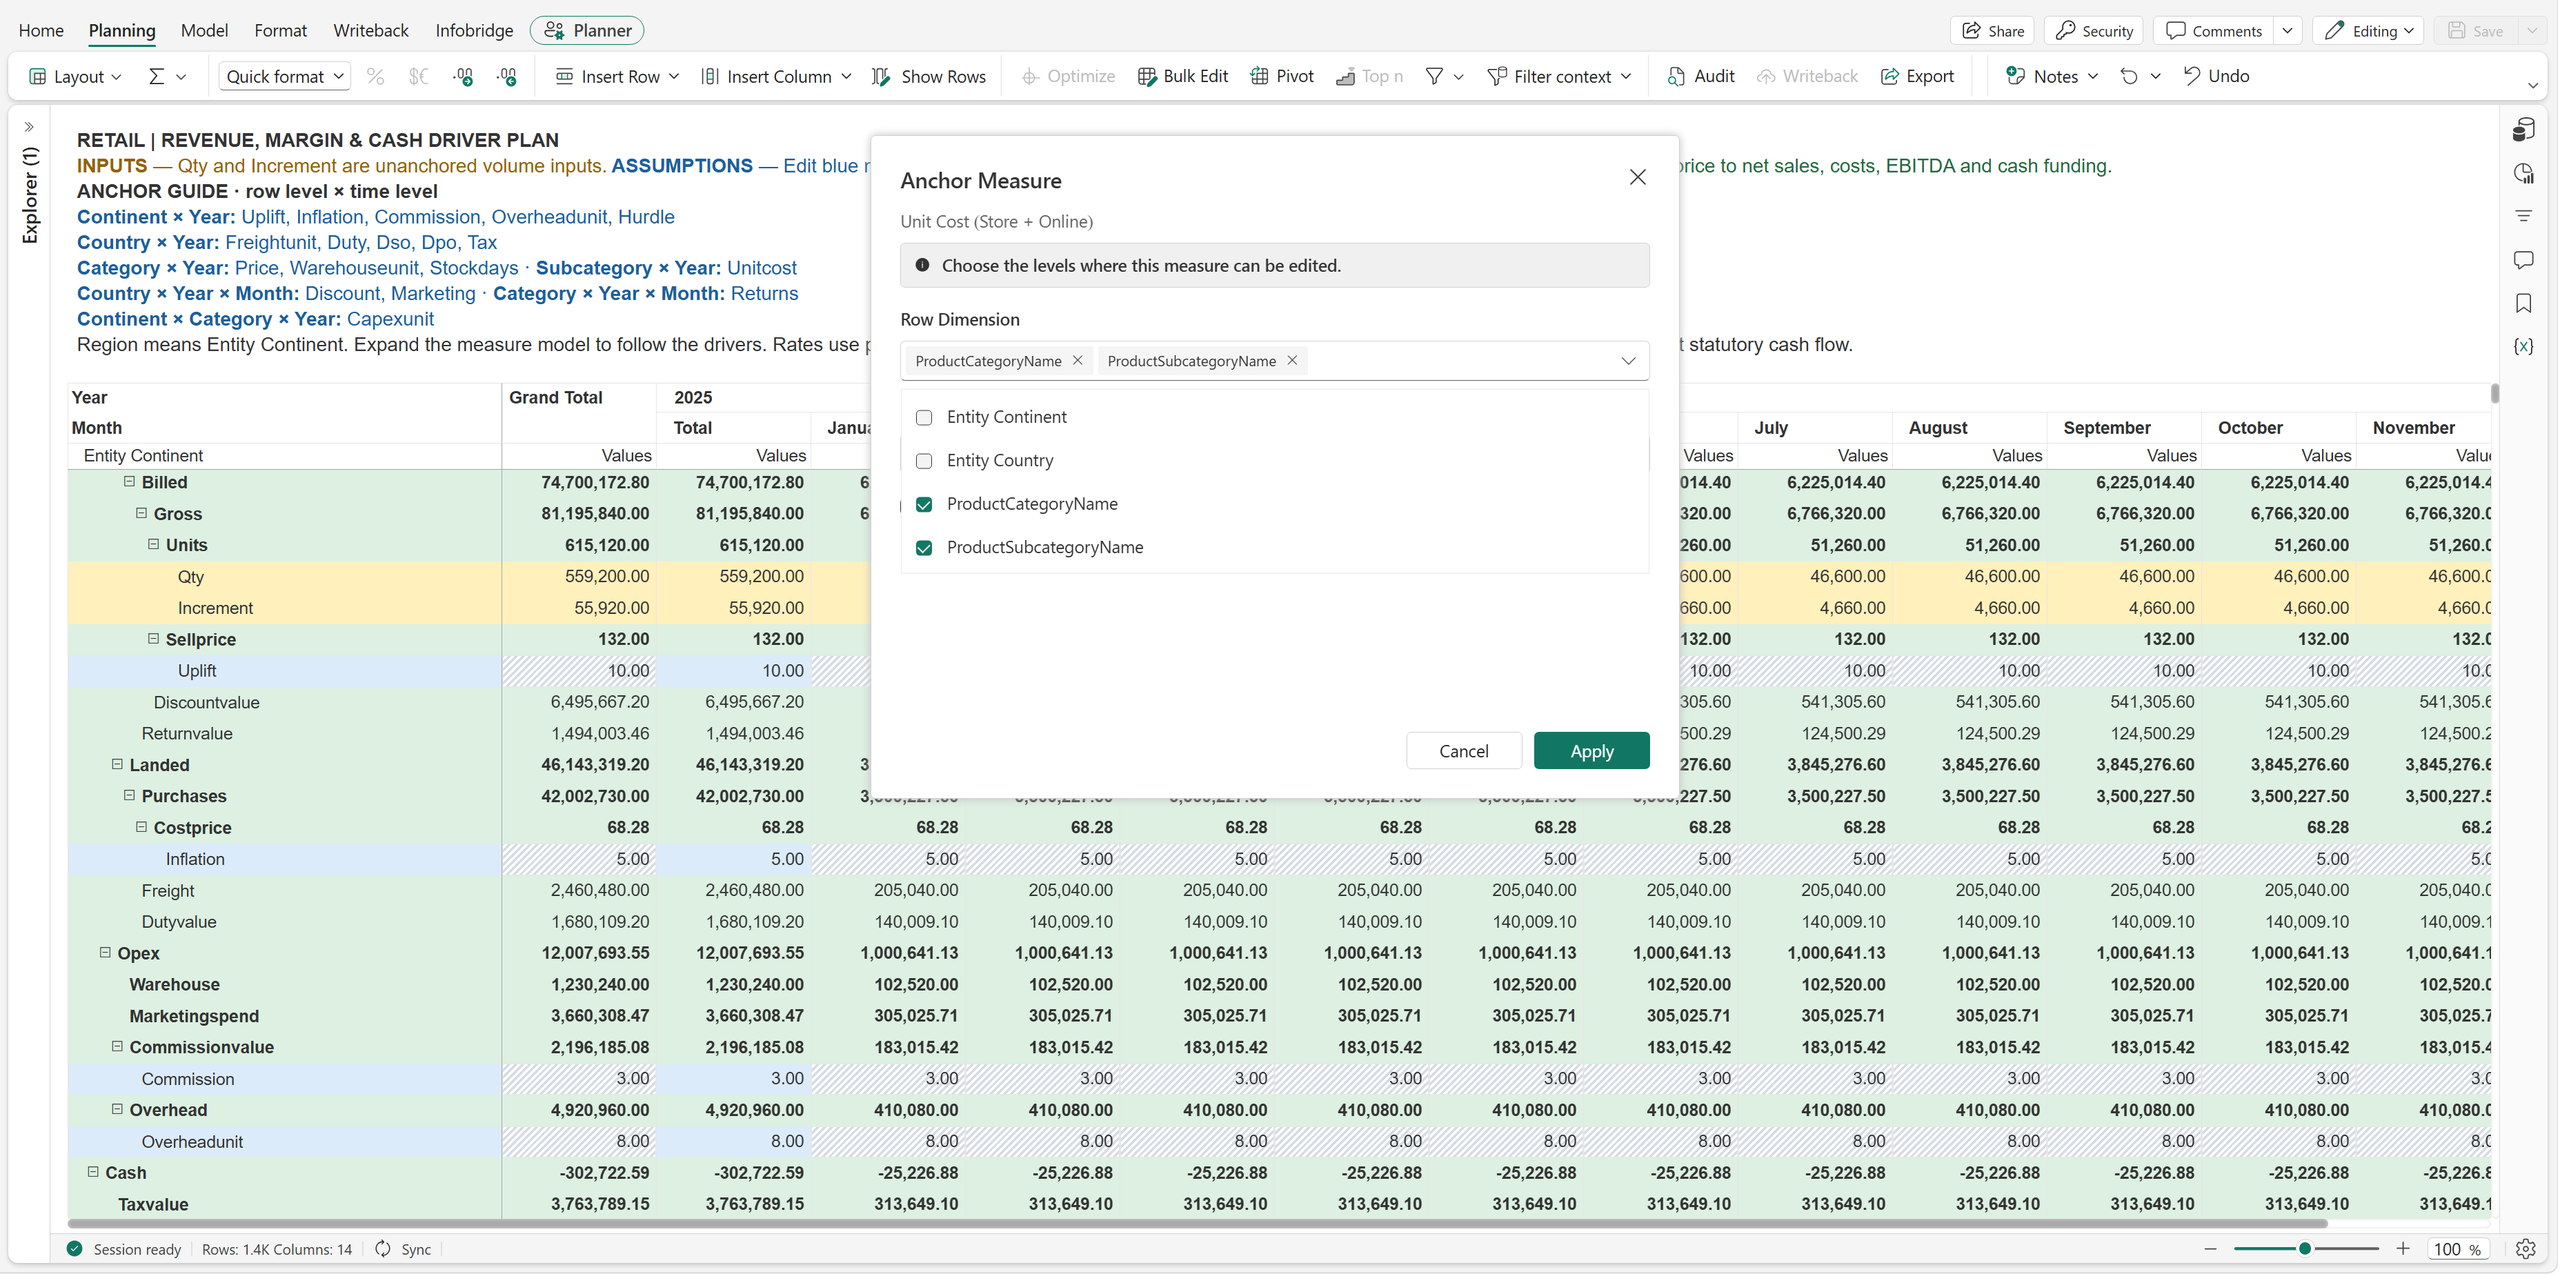
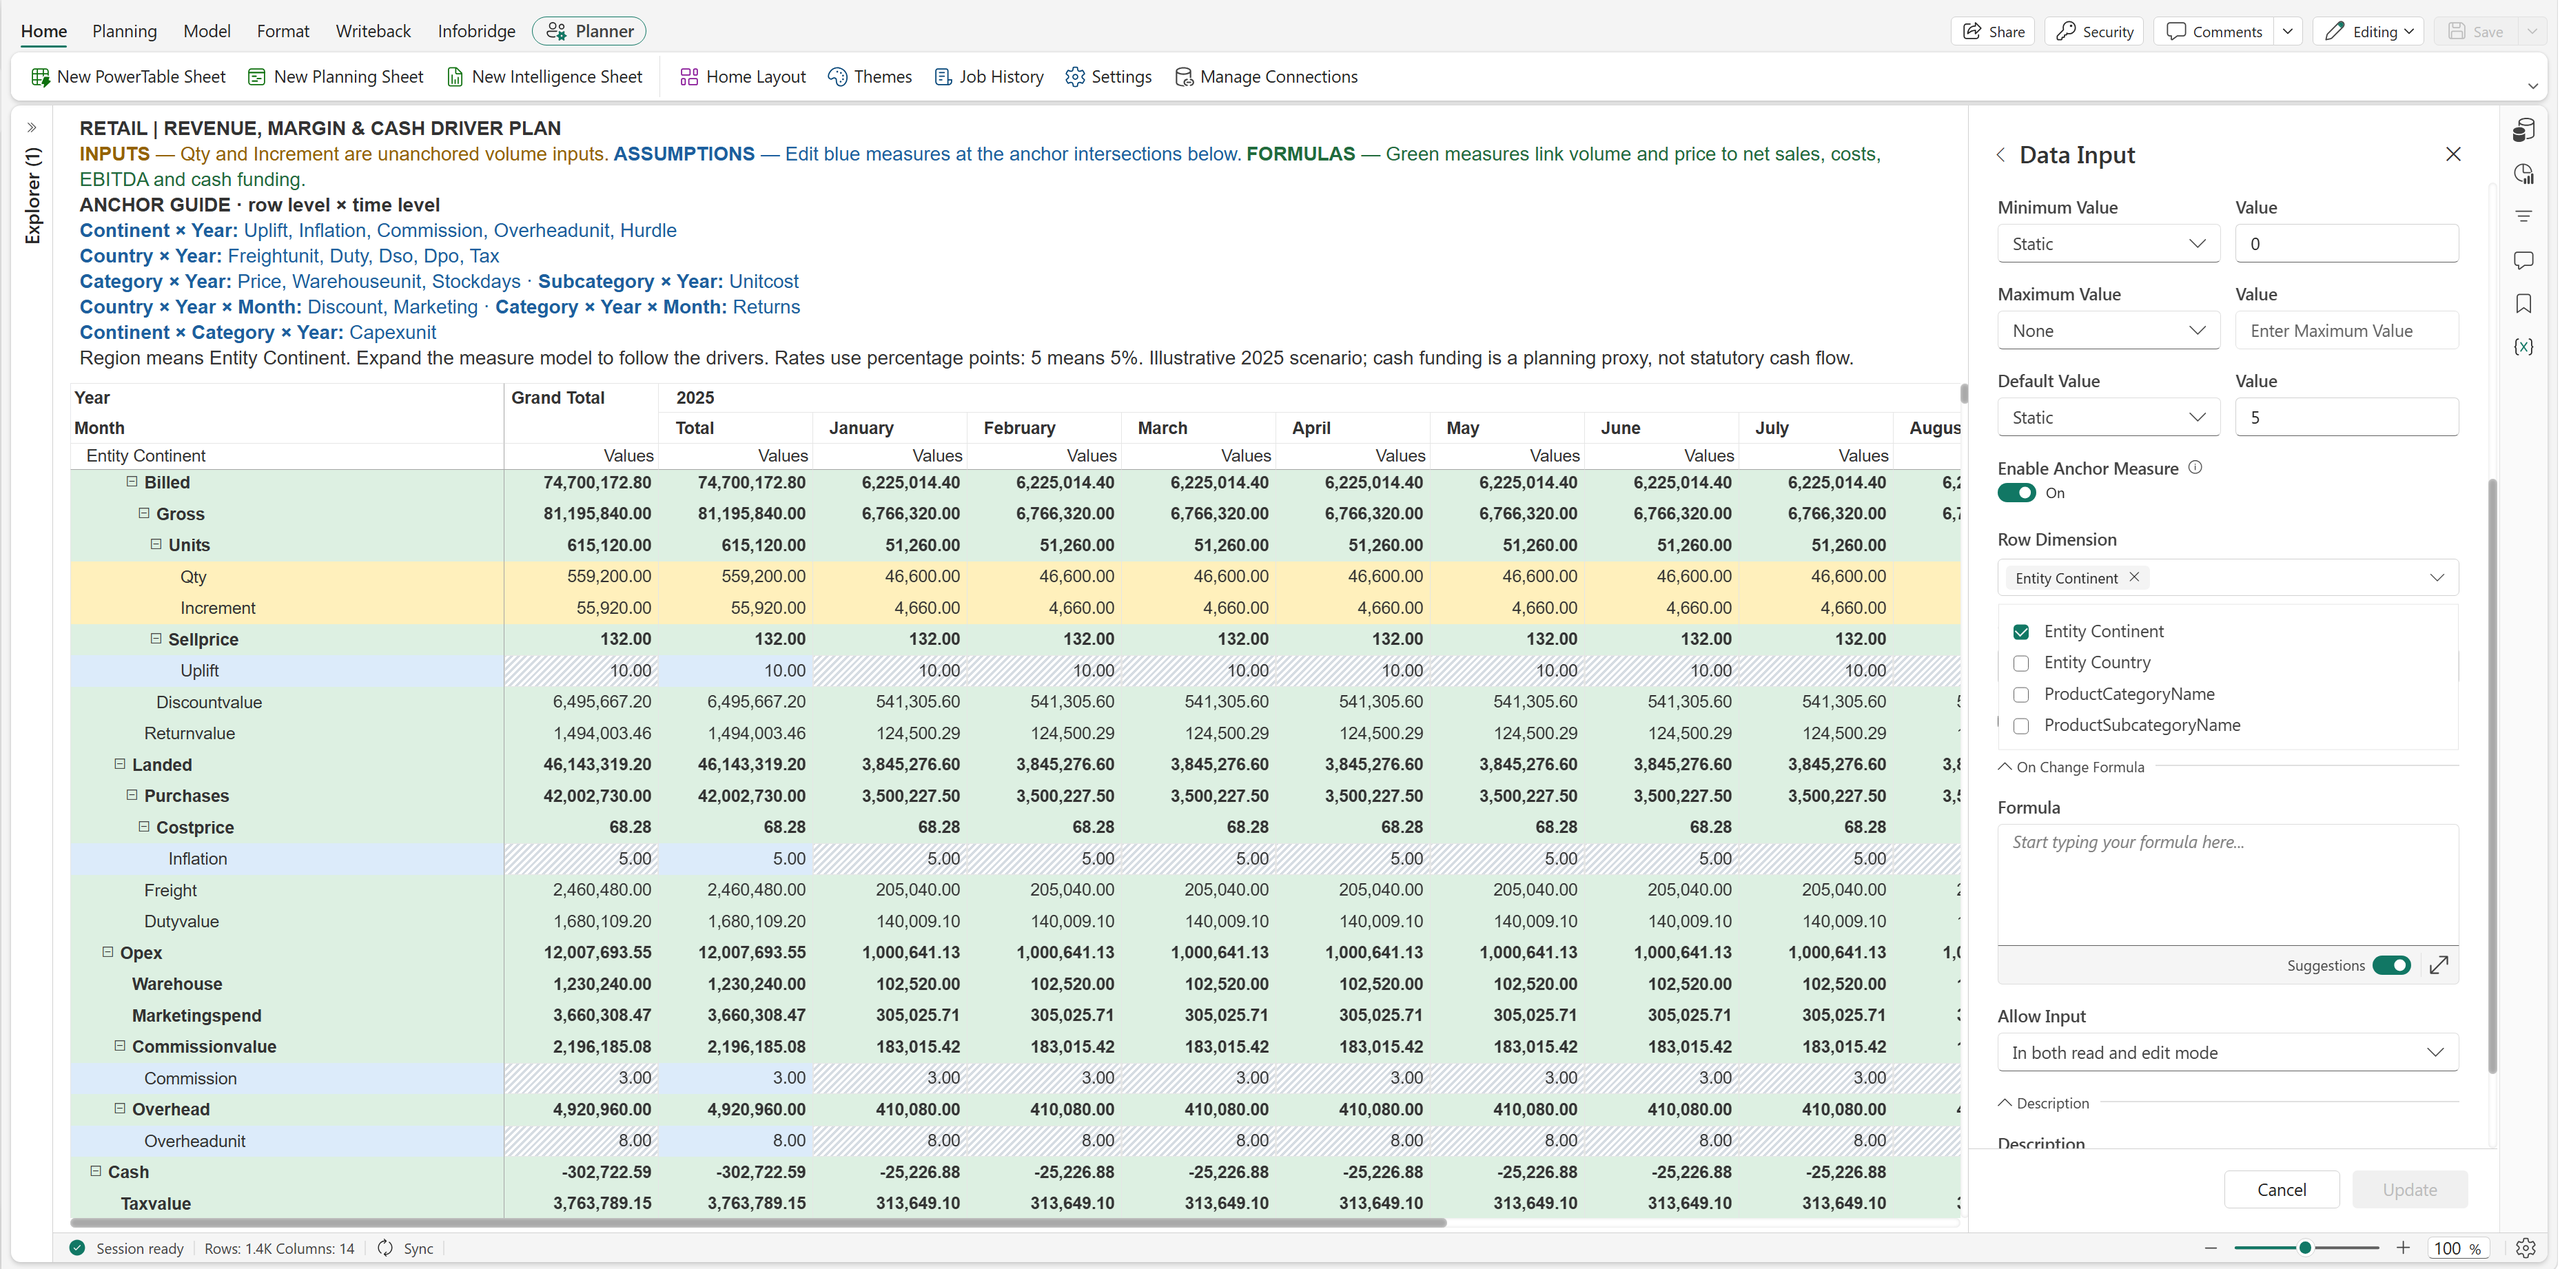
Open Manage Rows (Show Rows on the ribbon) or Manage Columns, locate the Power BI Measure, and click its anchor icon. In Anchor Measure, select the SKU dimension under Row Dimension, then apply the settings. Configure non-anchored instances to be hidden for the product-detail presentation.
The same approach is useful for measures such as standard weight per unit or price per pack when their meaningful reporting level is an individual product.
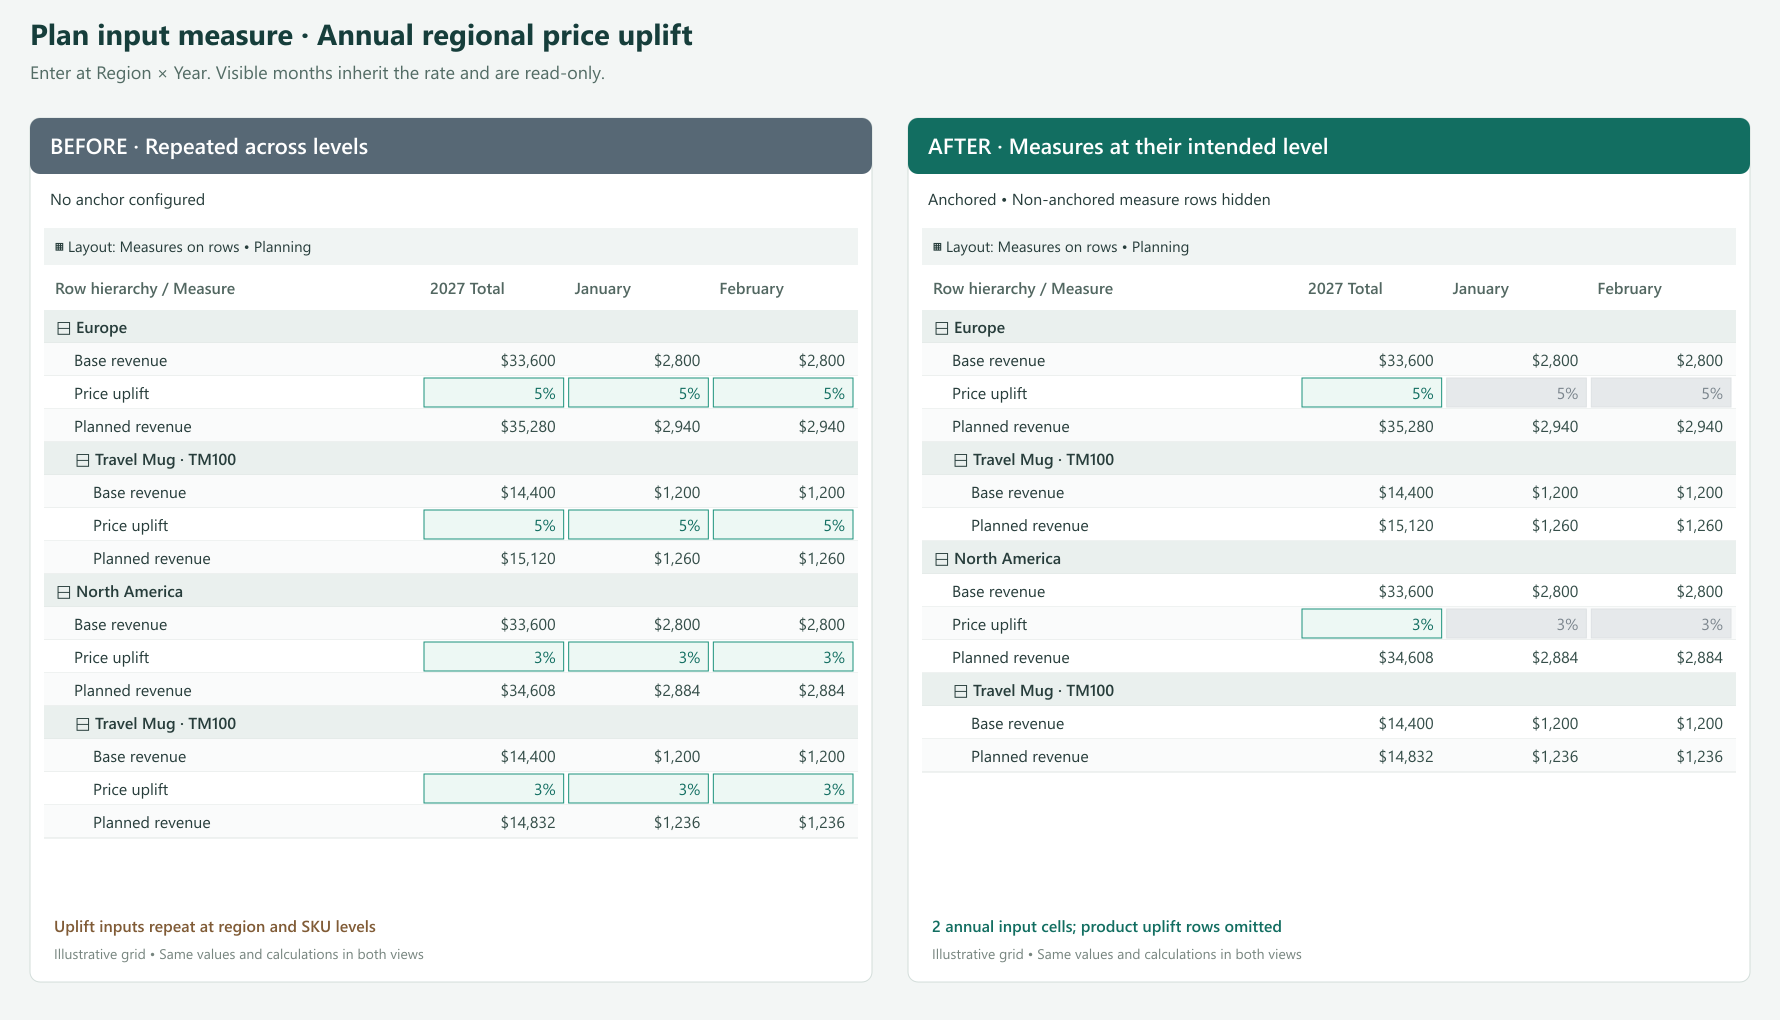
A pricing team agrees on an annual price uplift of 5% for Europe and 3% for North America. The sales plan contains hundreds of SKUs and twelve months of detail.
If the uplift is available for direct entry throughout the detail, users have many places to maintain a decision made once per region and year. They may copy the rate across cells or maintain a separate assumptions block above the plan. It becomes harder to tell whether a different value is intentional or an accidental override.
Anchor the Price Uplift input measure to Region × Year. Europe has one annual input point for its 5% assumption; North America has another for 3%. Users enter the values at the corresponding year subtotal.
With the existing distribution configured to repeat the rate, eligible detail receives the regional assumption. A product with a base price of $24 therefore has a planned price of $25.20 in Europe and $24.72 in North America, using:
Planned price = Base price × (1 + Price uplift)
The formula and distribution produce those values. The anchor makes the location for maintaining the assumption explicit. Monthly instances that remain visible are read-only; they are not separate places to override the annual policy.
An annual assumption belongs in the annual subtotal, not January. A quarterly assumption belongs in the quarter subtotal.
| Planning decision | Anchor | What users maintain |
|---|---|---|
| Annual salary increase | Year only | One annual policy shared across the employee plan |
| Regional benefit rate | Region × Year | One annual rate per region, such as 22% or 26% |
| Seasonal demand uplift | Year × Quarter only | One quarterly assumption shared across products and regions |
| Monthly promotion | Country × Year × Month | A discount assumption that varies by country and month |
| Inventory policy | Product category × Year | Annual target stock days for each category |
Neither row nor column selection is individually mandatory. With anchoring enabled, select at least one dimension overall. A time-only seasonal factor can leave Row Dimension empty. A factor that varies only by region can leave Column Dimension empty.
A regional management view includes Revenue, EBITDA, and EBITDA Margin. Users can expand the same grid to inspect categories and SKUs, but leadership wants profitability measures at the regional quarterly summary.
Showing EBITDA and EBITDA Margin beneath every SKU makes operational detail harder to scan. It can also encourage readers to interpret product-level profitability when some operating expenses are managed at a broader level. Teams may maintain a separate executive report simply to keep those measures out of the detail view.
Anchor the plan’s formula measures EBITDA and EBITDA Margin to Region × Year × Quarter. If Region is the top row level, those measures appear at the top business summary level for each region. SKU detail can focus on quantity, price, and revenue.
For example, Europe has quarterly revenue of $2.4 million and EBITDA of $360,000. Its existing formula calculates:
EBITDA Margin = EBITDA ÷ Revenue = 15%
Anchoring places that 15% where leadership reviews the result. It does not average displayed SKU percentages or change how the formula evaluates. Hiding detail instances also does not remove the data or dependencies needed to calculate the summary.
Use the same pattern for Profit Margin or Operating Profit at a selected management level. Choose the highest business dimension you want to present, such as Company, Business Unit, or Region, together with the relevant period.
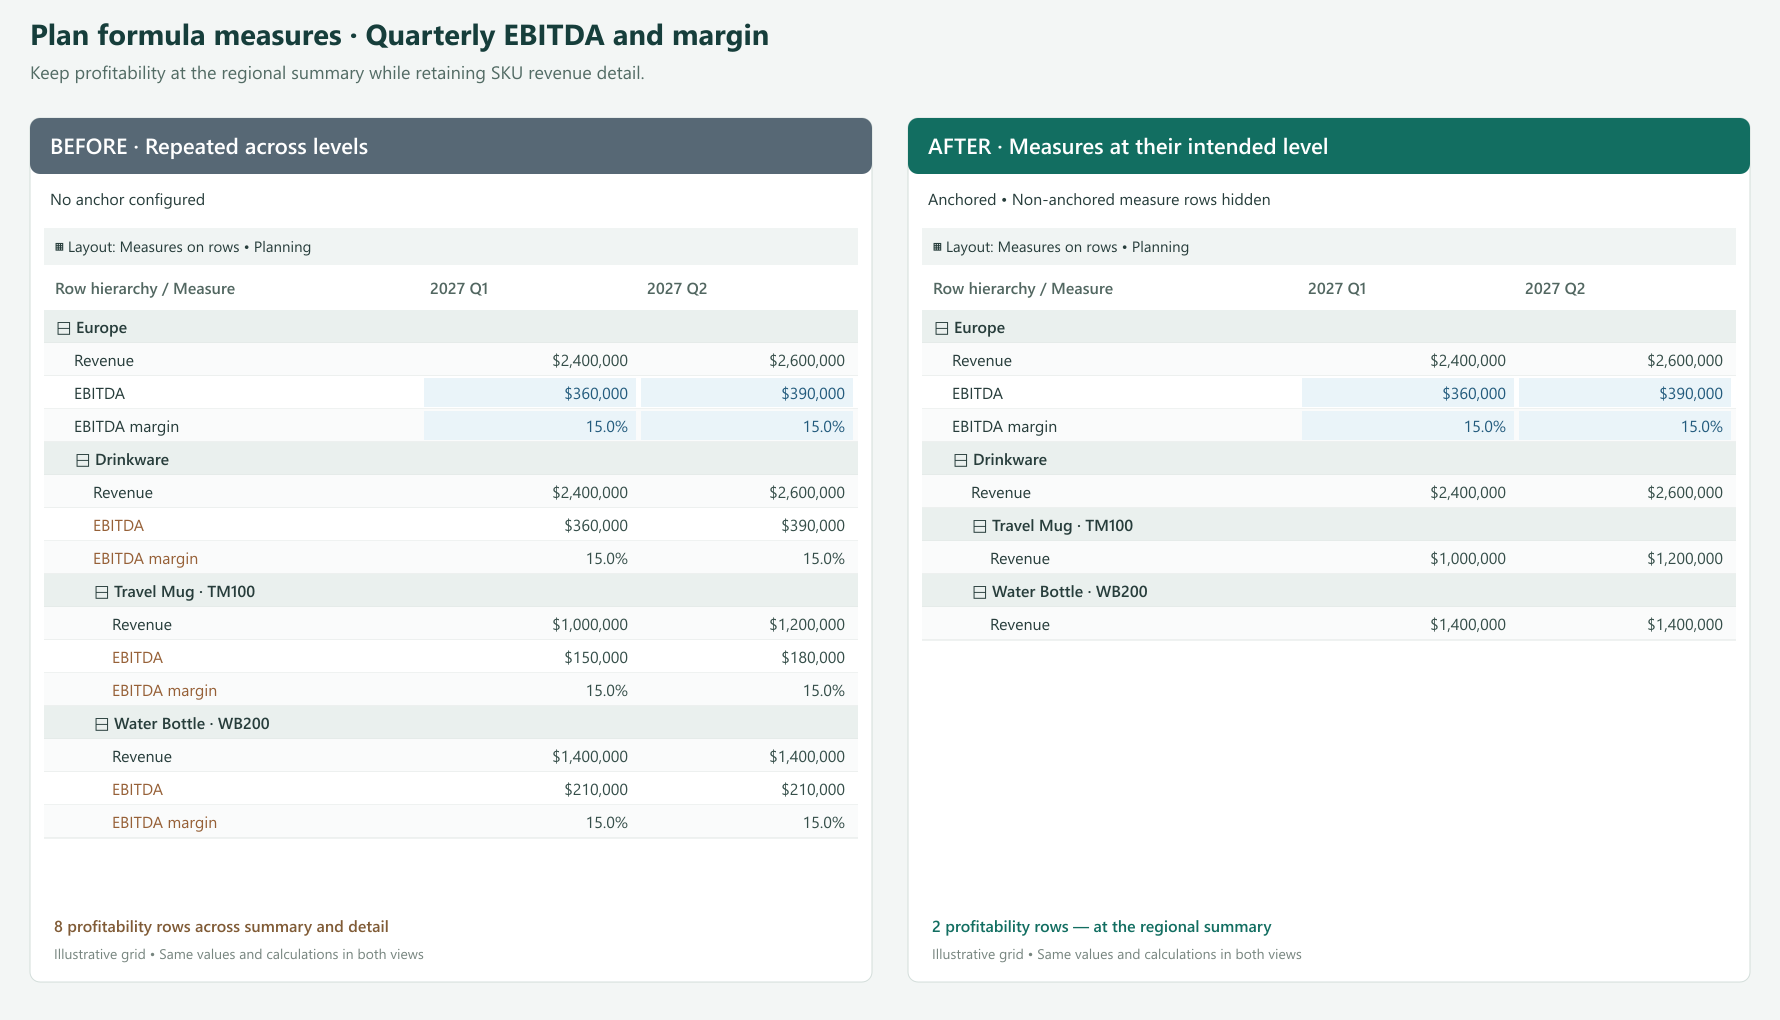
Open the formula measure’s anchor settings through its configuration or the anchor action in Manage Rows / Manage Columns. Select Region as the row dimension and Year and Quarter as the column dimensions. Apply the settings and hide non-anchored instances for the summary-focused presentation.
The formula remains calculated and read-only. Anchoring does not make a formula measure or a Power BI Measure directly editable, even when the shared dialog describes where a measure can be edited.
Show non-anchored instances when users need to follow an assumption into the detail; for input measures, these cells remain read-only. Hide them when the repeated measure adds no useful information.
A regional assumption need not have its own input row under every product in a measures-on-rows layout. A quarterly assumption need not add an input measure column beneath every month in a column layout. Hiding removes unnecessary instances where the layout permits while calculations continue to use the underlying values.
Read-only detail can still receive updates through the existing allocation or distribution process from a valid editable anchor. Normal permissions and locking rules continue to apply. Anchoring controls placement and entry locations; aggregation and allocation settings determine how values are distributed and rolled up.
| Measure type | Example | Appropriate placement | User interaction |
|---|---|---|---|
| Power BI Measure | List price or standard unit cost | SKU detail | Read the existing model value |
| Input measure in the plan | Annual regional uplift | Region × Year subtotal | Enter the assumption at the anchor |
| Input measure in the plan | Quarterly seasonality | All rows × Year × Quarter | Maintain one shared period assumption |
| Formula measure in the plan | EBITDA or profit margin | Management summary × reporting period | Review the calculated result |
Start with a measure that appears in too many places. Put it at the level where it is useful, expand the grid, and check how the detail reads. Then apply the same approach to other measures in the plan.
Product facts at product detail. Assumptions where decisions are made. Results where the business reviews them. Anchoring Measures brings those needs together in one planning and reporting view.
Feature details reflect Fabric Plan at the time of writing.




Comments
0Please log in to comment.