Number and Percentage on one chart without the percentages flatlining

Started by Daniel · 2 months, 2 weeks ago · 1 reply · 136 views
Daniel Participant
2 months, 2 weeks ago

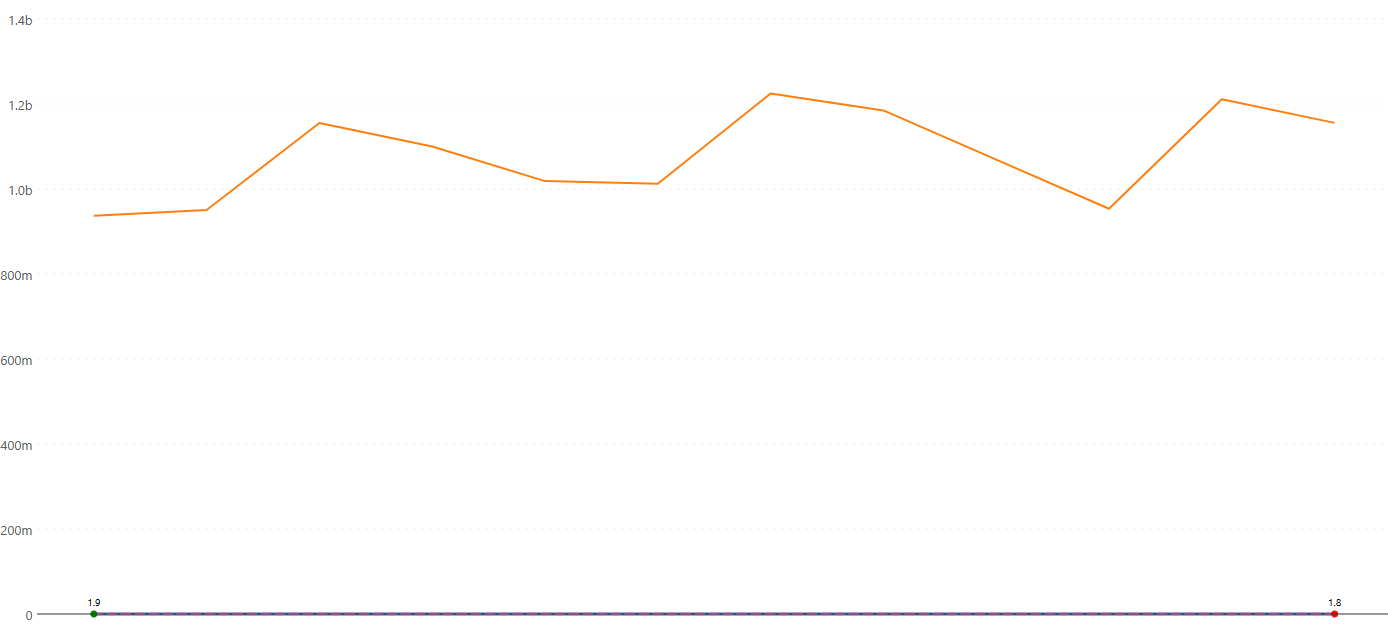
I'm trying to put Revenue, Margin % and Growth % on the same combo chart in an Intelligence Sheet. Revenue is in millions, the two percentages sit near the bottom and basically flatten into a straight line when they share the same axis. A single secondary axis fixes Revenue vs one percentage, but I've got two percentages that don't even share the same range as each other, so one still gets squashed.

For those of you who report all three together, do you split them across more than one secondary axis, or do you keep the percentages off the chart entirely and show them some other way, so nobody reads the wrong scale?
1 Reply
Accepted answer
chartvizLumel Staff
2 months, 2 weeks ago
Best Answer

If you have three measures with different scales, you can use the Multi Axis Chart. This allows you to plot each measure on a separate axis, for example:

  • Revenue on Axis 1
  • Margin % on Axis 2
  • Growth % on Axis 3

Additionally, under Toolbar → Series, you can choose a different series type for each measure, such as Line, Area, Column, Lollipop, or their variations.

The Multi Axis Chart is part of the Combo Chart family and is especially useful for advanced reporting scenarios where measures have significantly different ranges. You can avoid flat lines by using this solution.

Hope this helps!

Viewing 1 replies (of 1 total)

Microsoft, Azure, Copilot, Excel, Fabric IQ, Microsoft Entra, Microsoft Fabric, Microsoft Teams, OneLake, Outlook, Power Automate, Power BI and SharePoint are trademarks of the Microsoft group of companies. IBCS is a registered trademark of IBCS Association. All other trademarks are the property of their respective owners.

This community is operated independently by Lumel. Nothing on this site constitutes a representation or warranty by Microsoft.