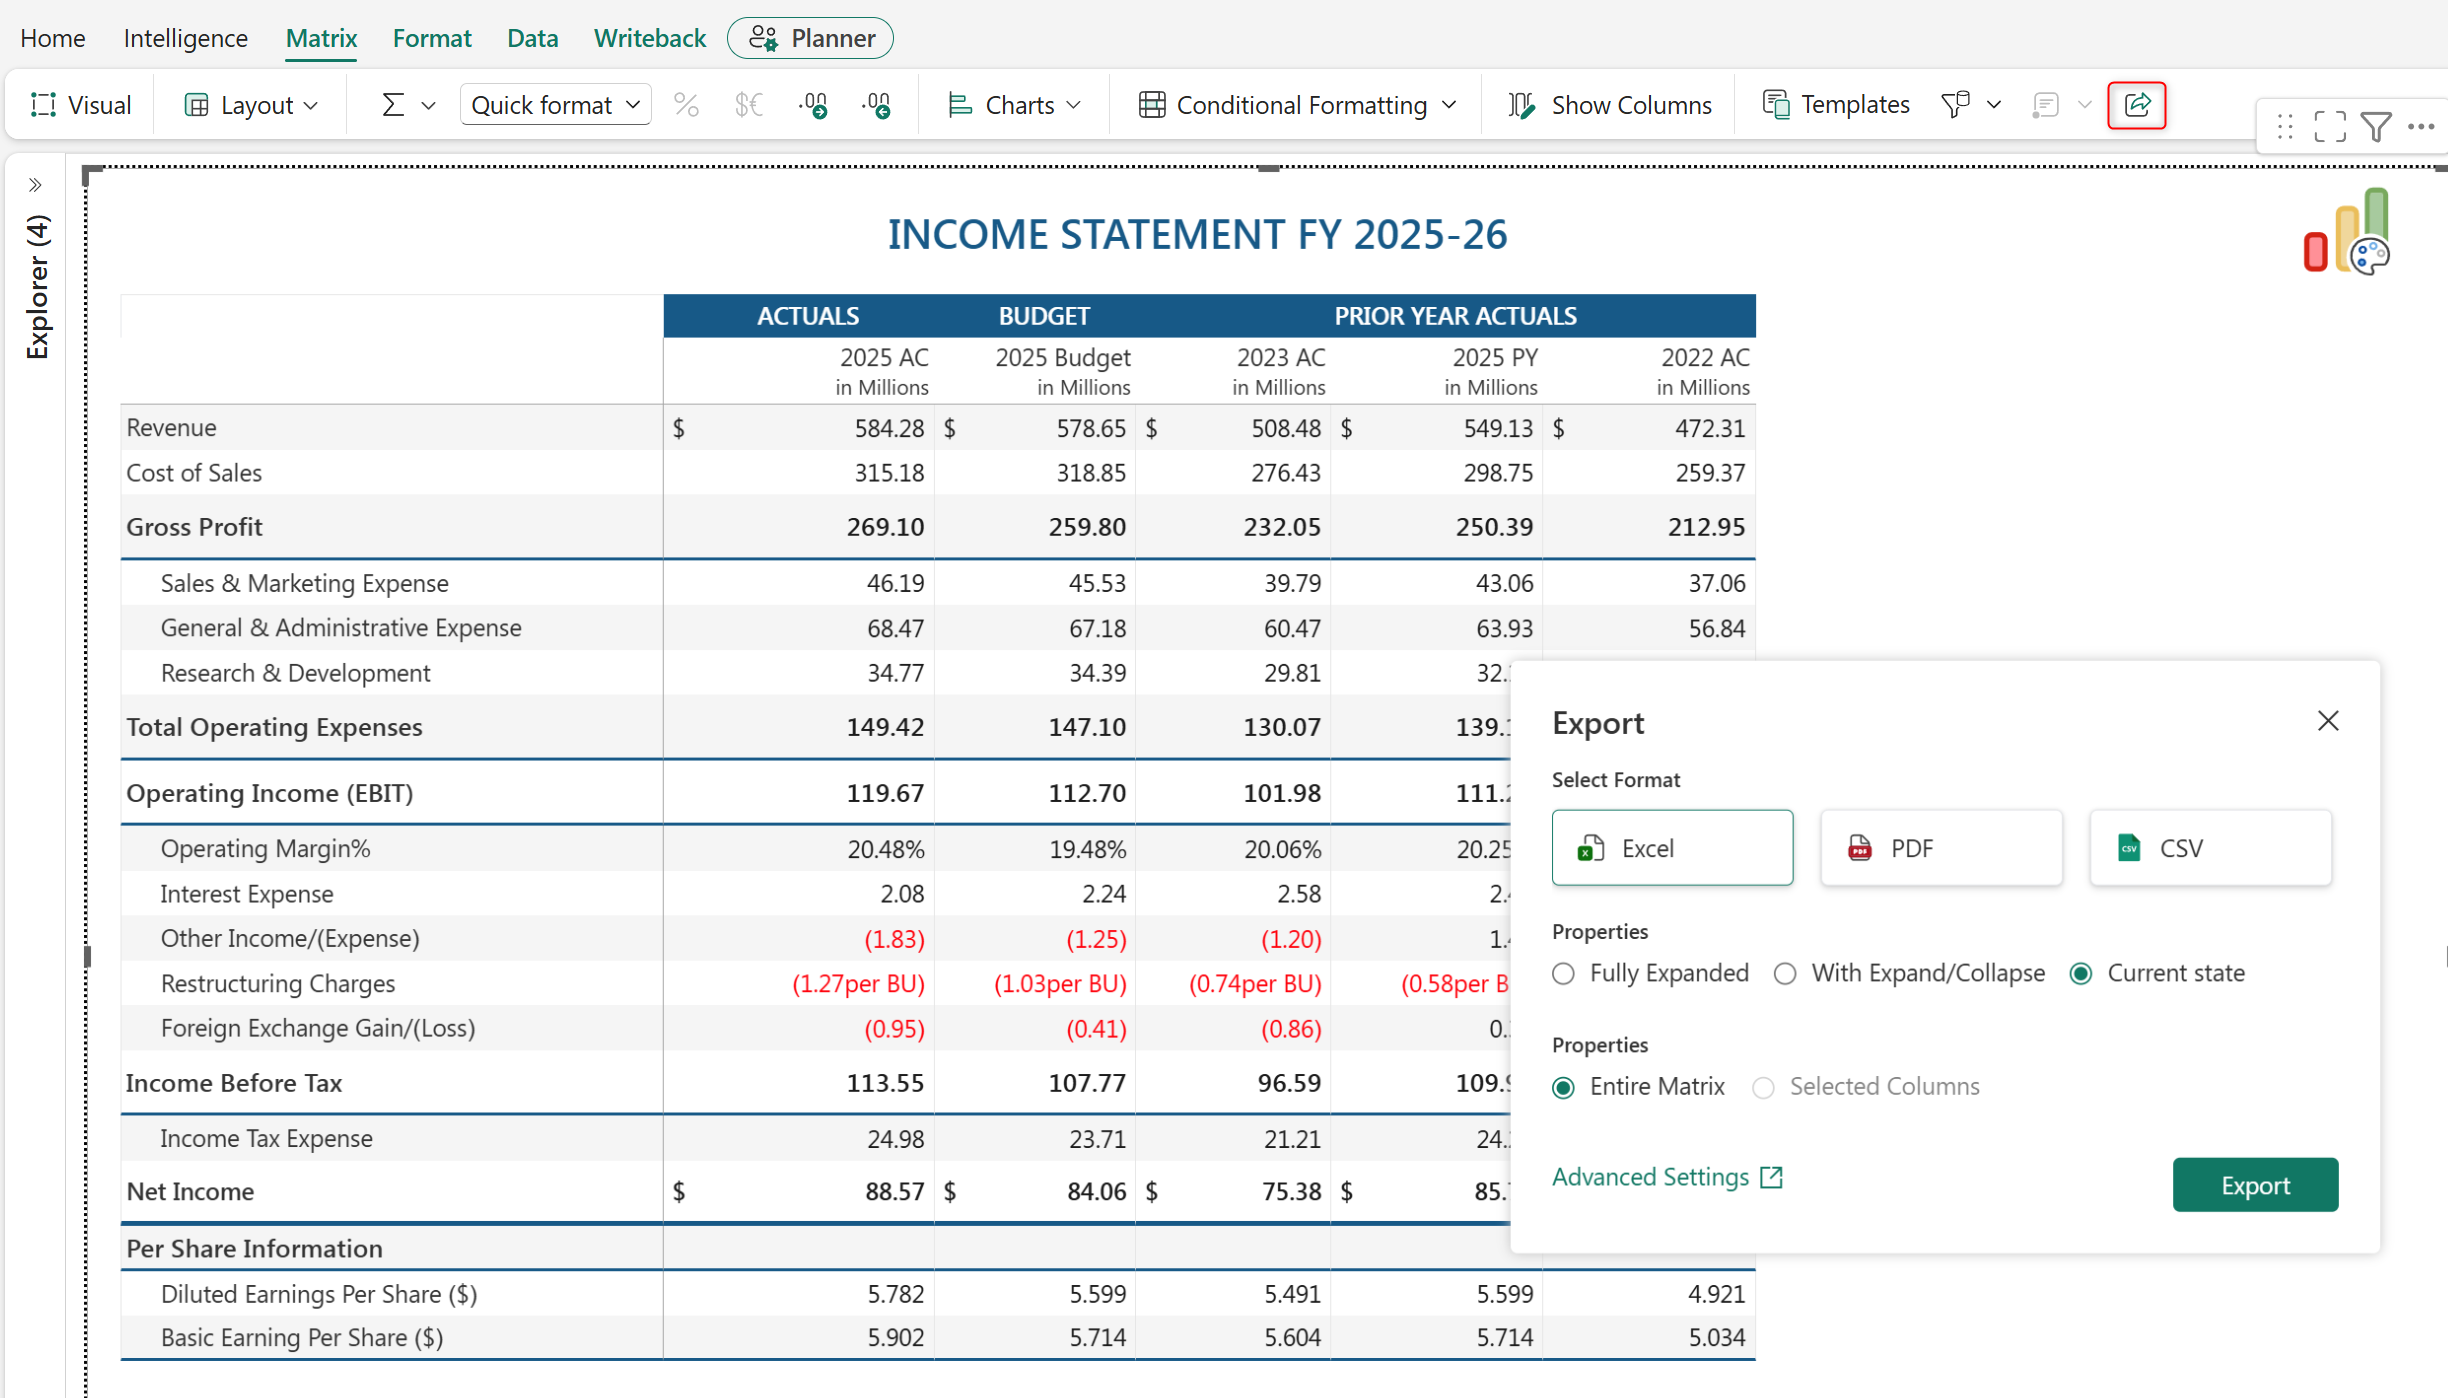
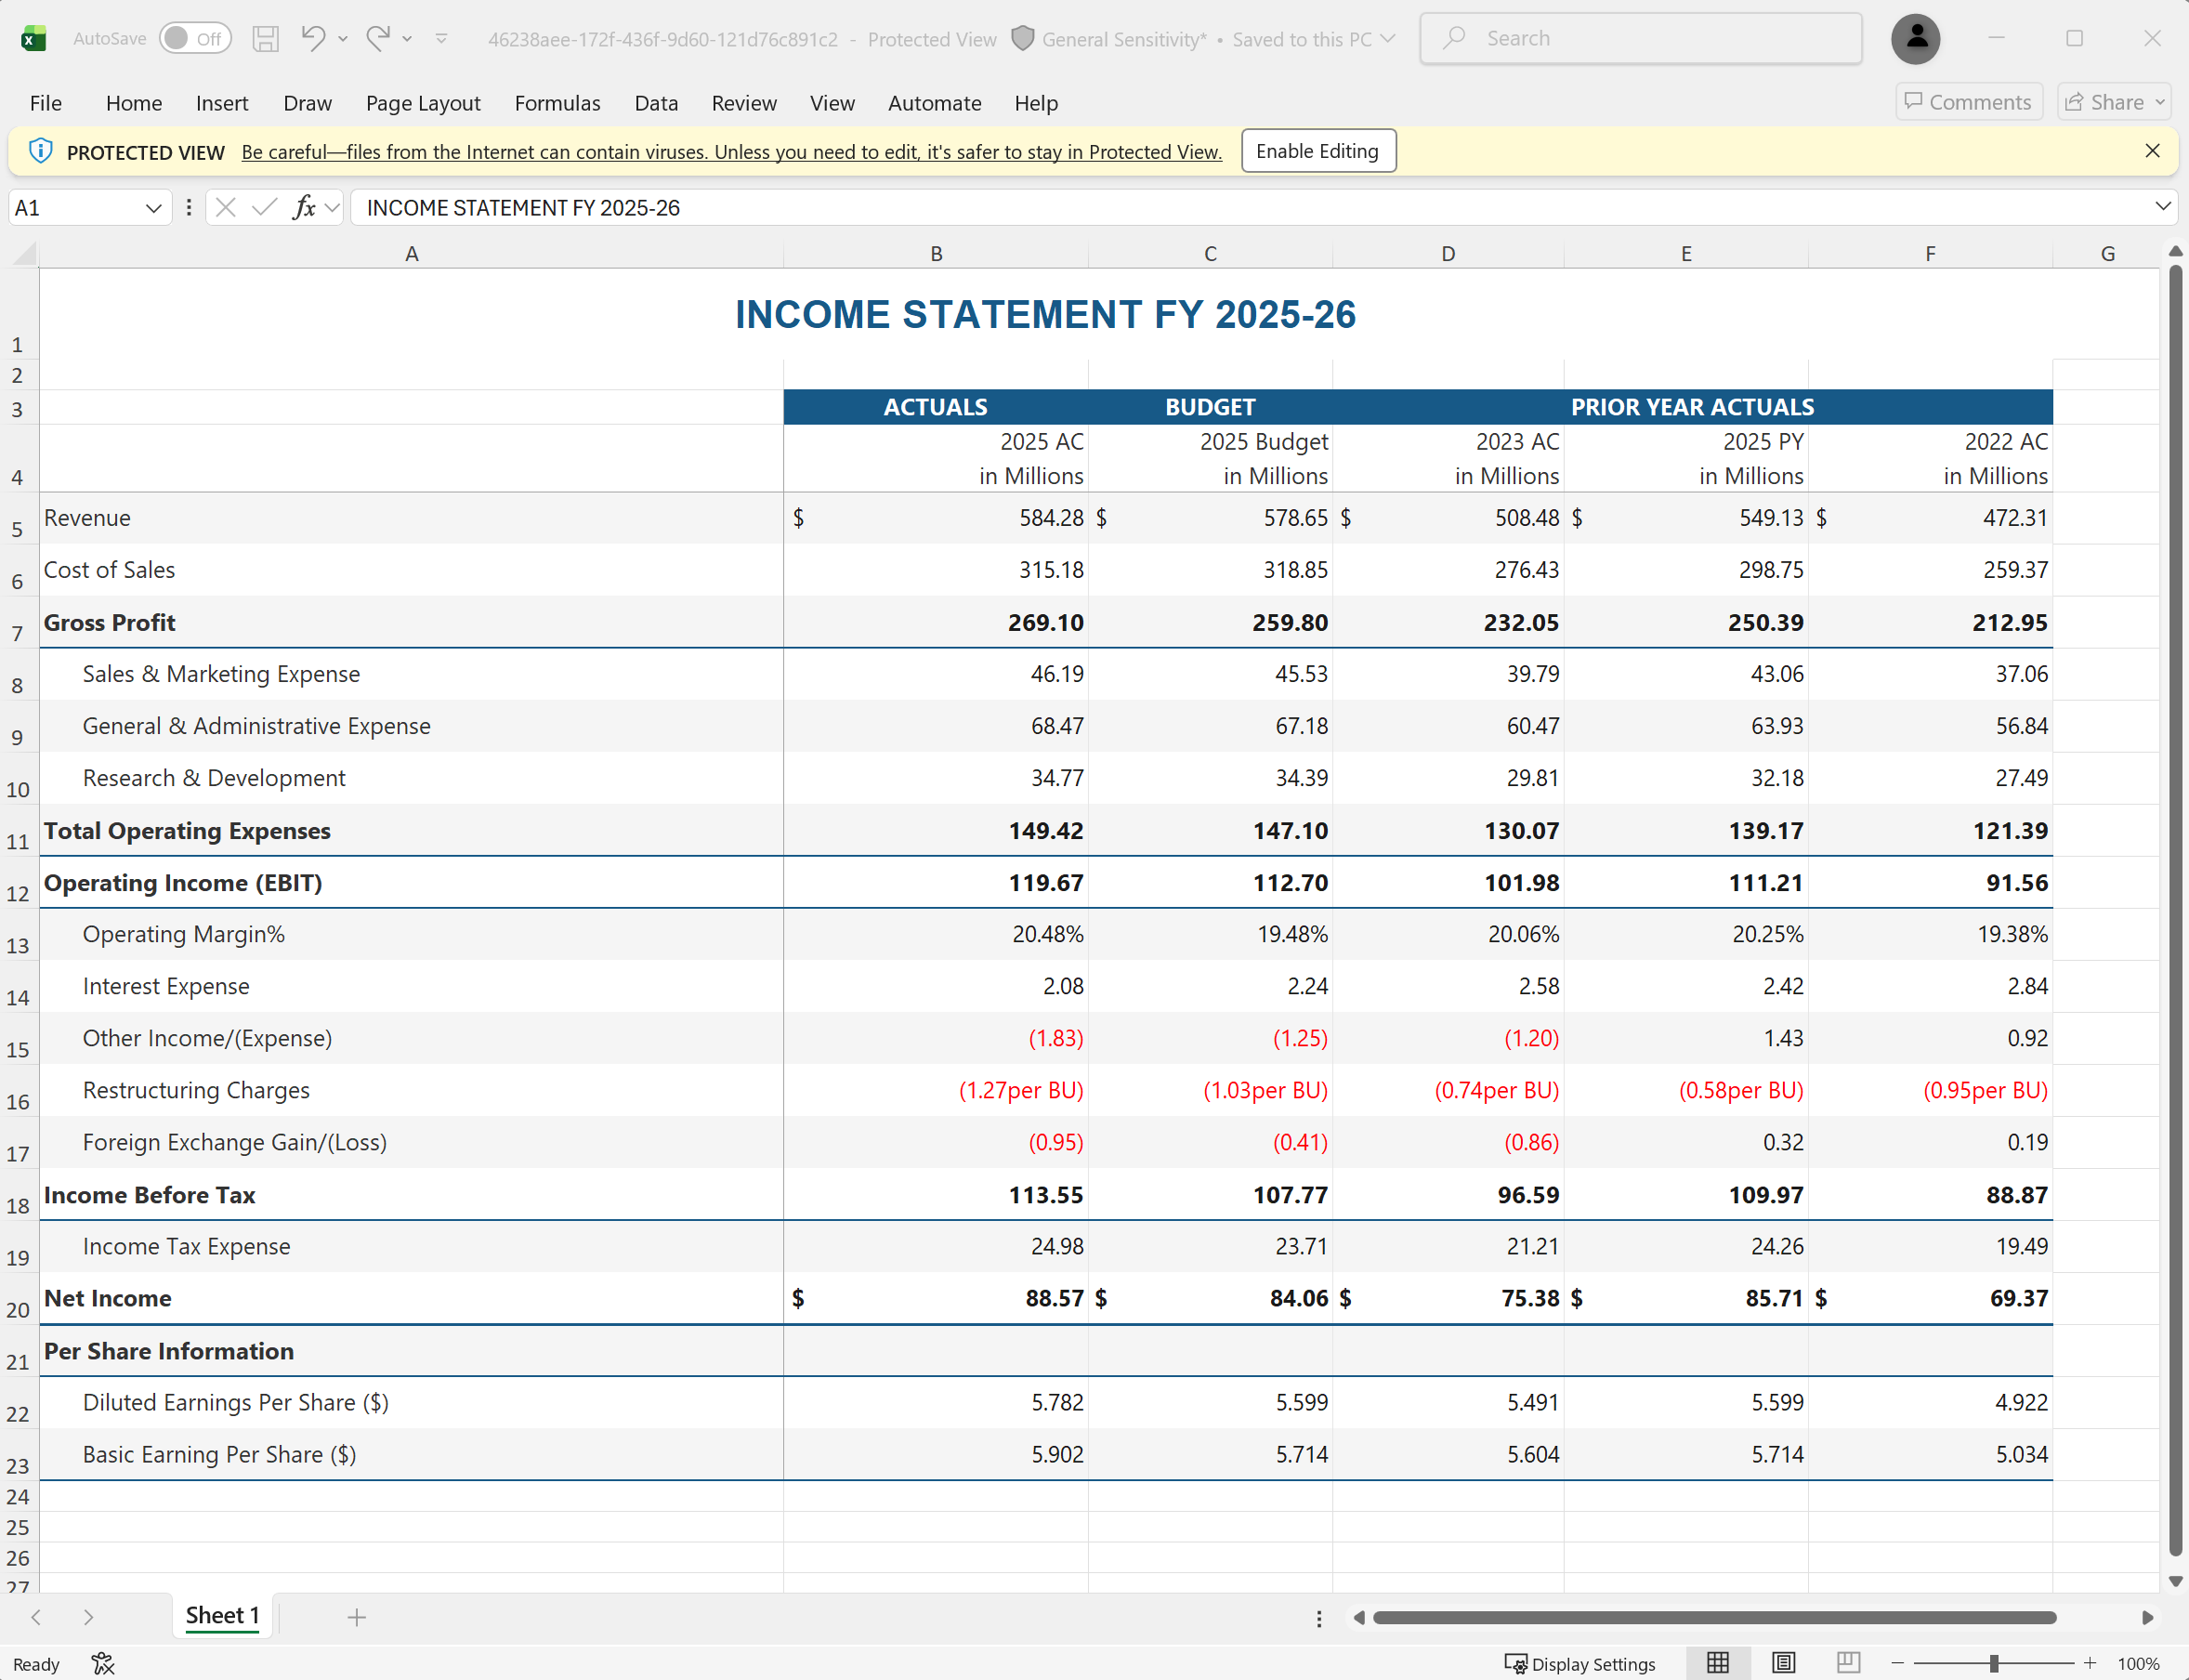
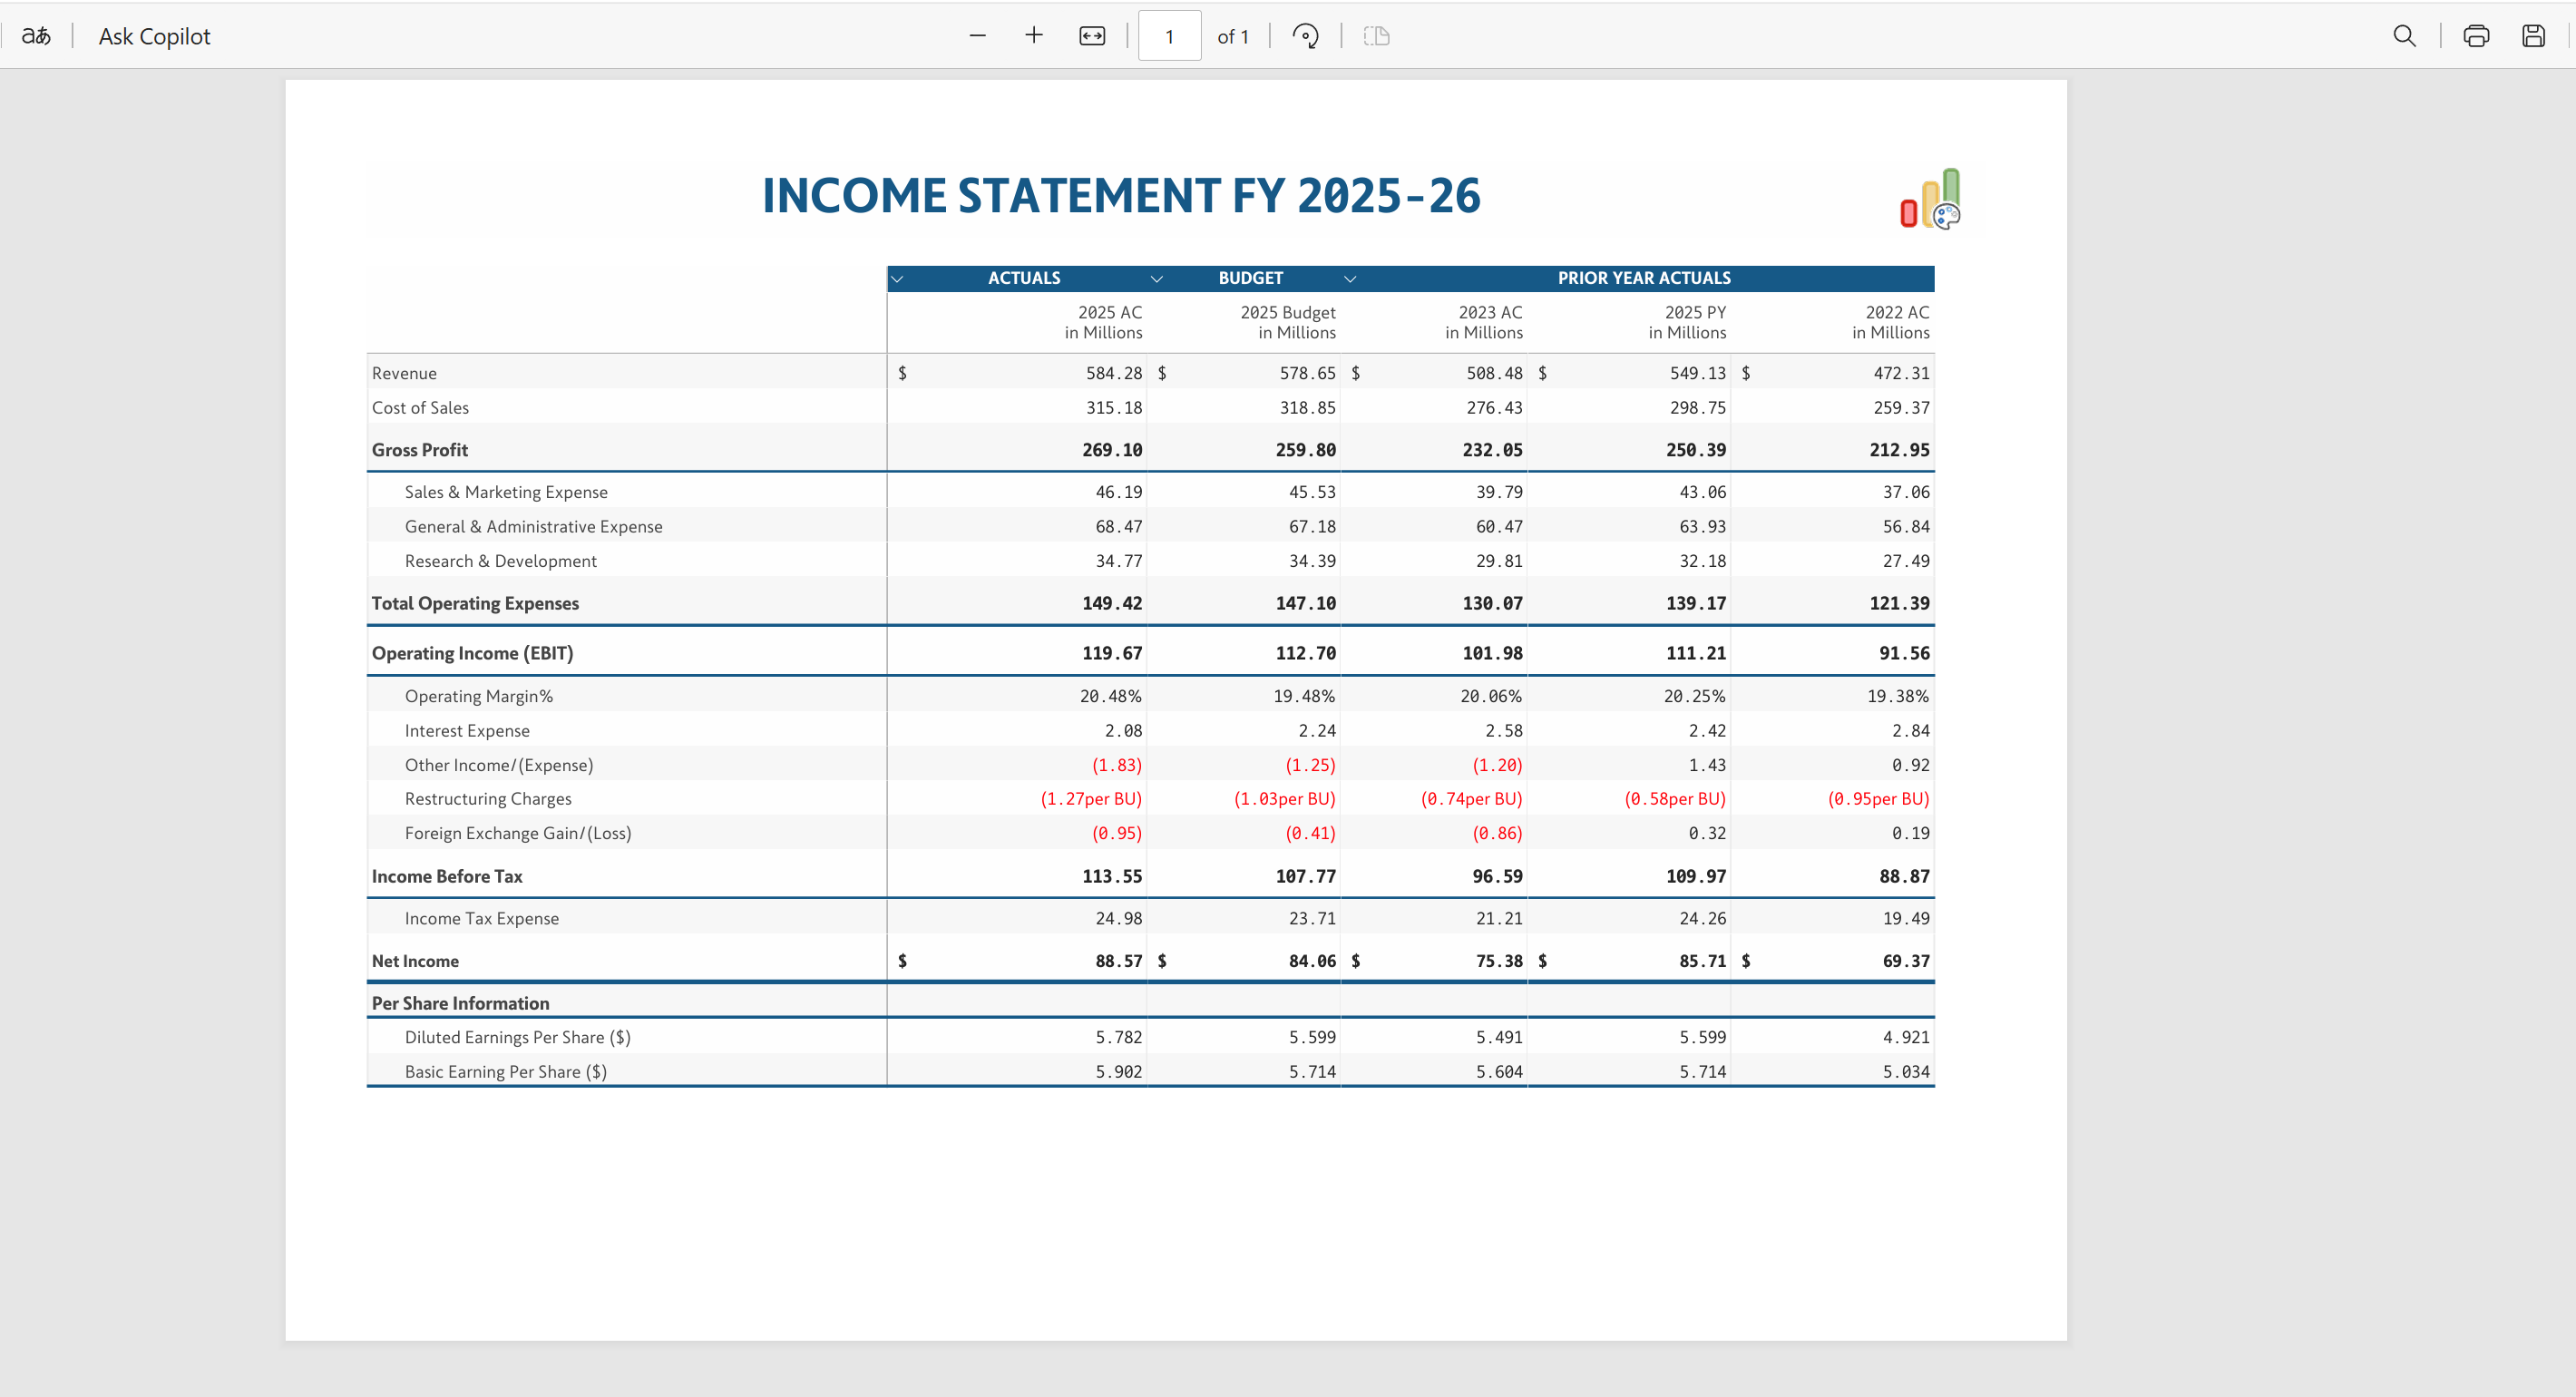
Intelligence sheets include built-in features that make it easy to present financial data in a clear format. You can organize metrics into a structured layout that supports both on-screen analysis and formatted exports.
Apply custom number formatting and scaling, use single-click templates, display totals and subtotals, and insert calculations. Together, these capabilities help you create presentation-ready financial reports that support planning, analysis, and decision-making.
This article provides a basic overview of how to create financial reports by using intelligence sheets.
Built-in report templates provide a quick starting point for creating reports. They reduce the time and effort required to build reports from scratch.
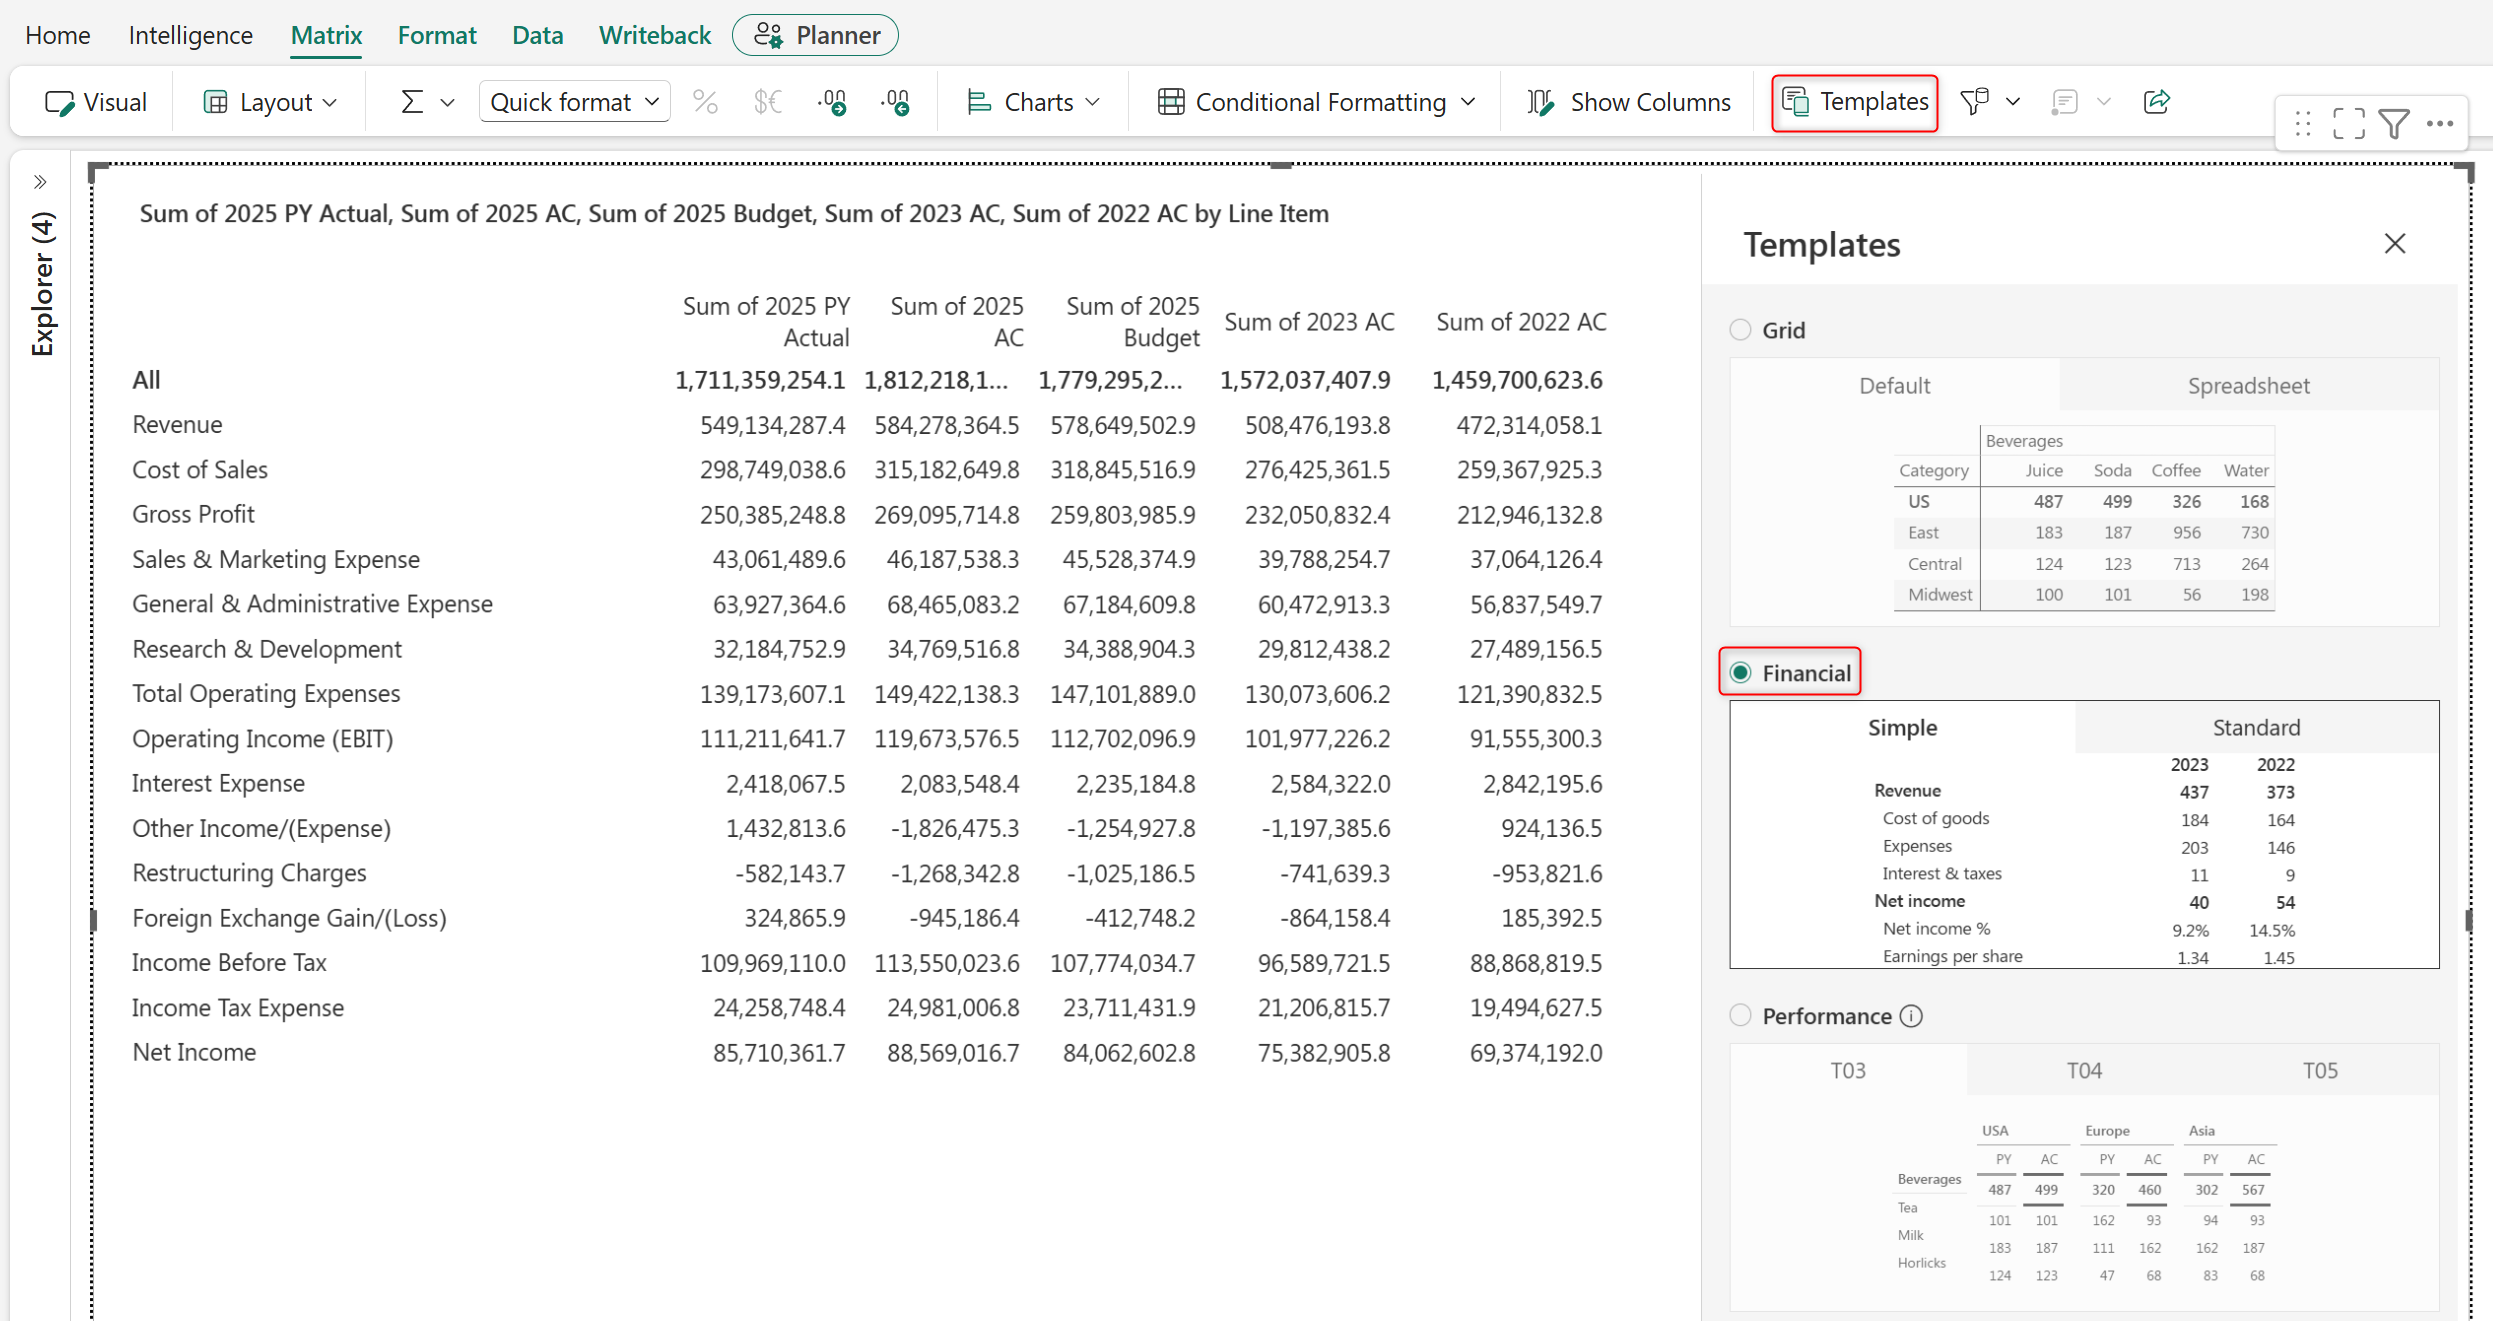
In the Matrix ribbon, go to Templates > Financial. Select the Simple template to create a financial statement with predefined layouts and formatting.
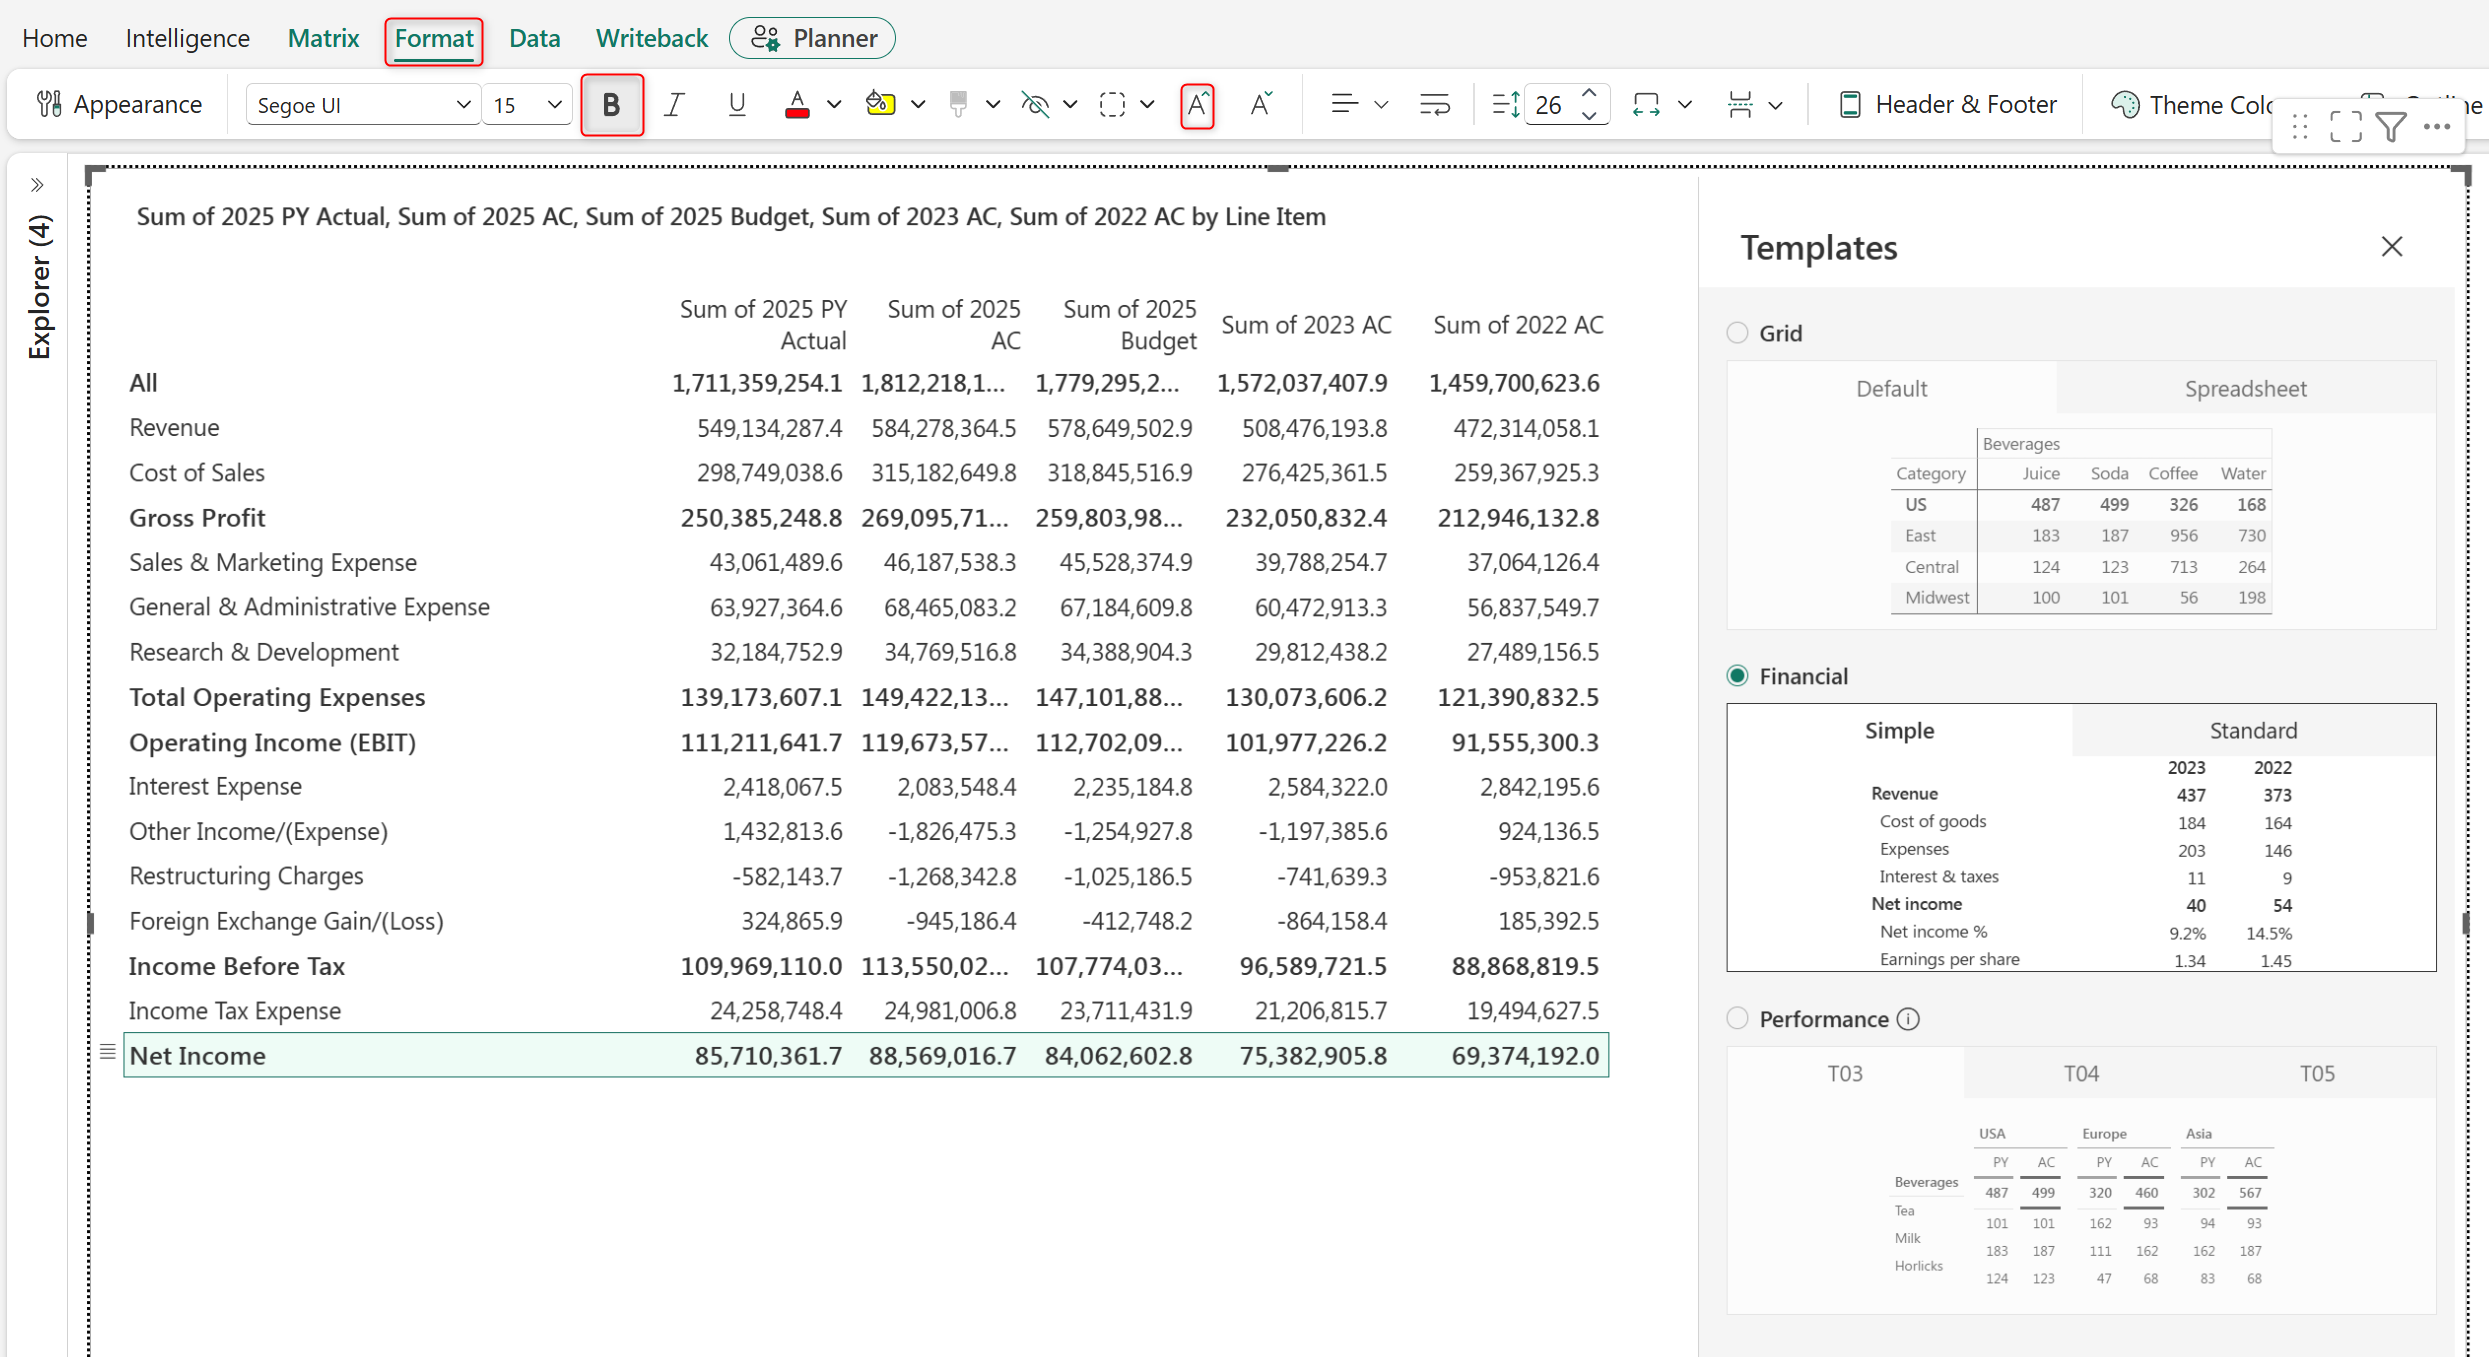
Select the total and subtotal rows, such as Gross Profit, Net Income, and Total Operating Expenses. In the Format ribbon, select Bold and increase the font size to distinguish the subtotal rows.
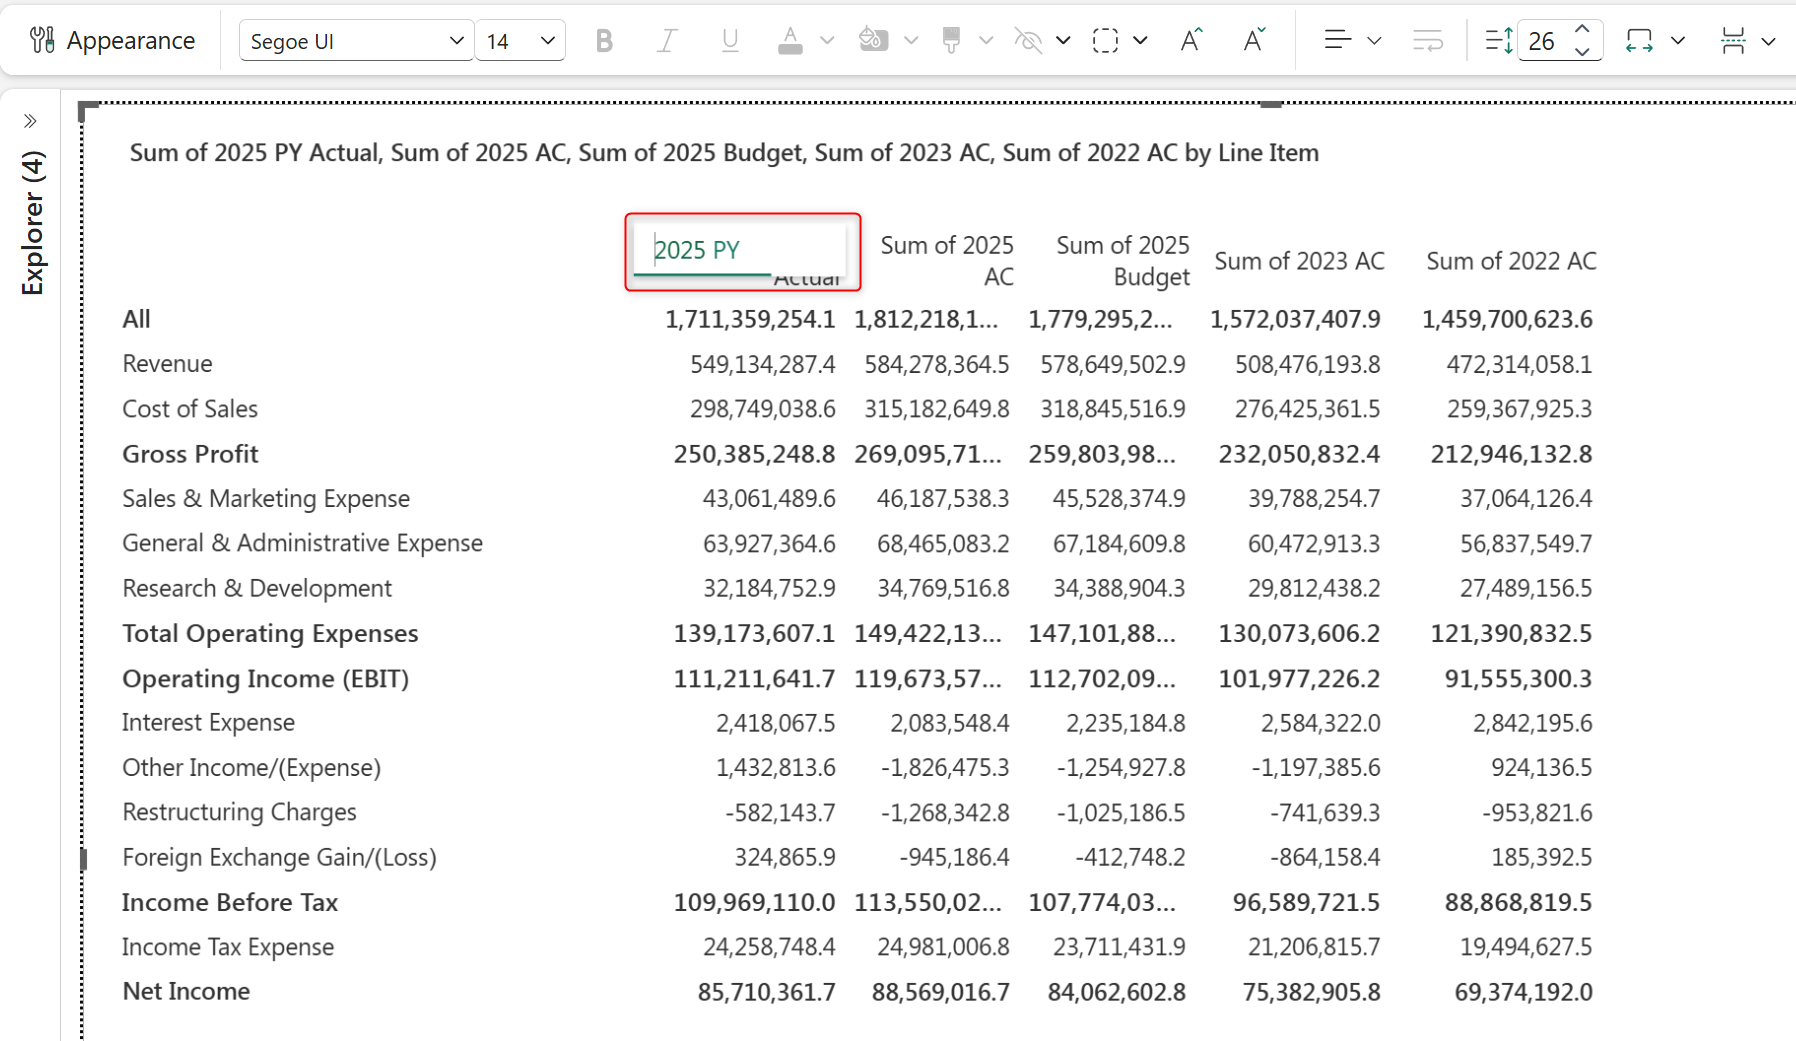
Double-click a column header and enter the required name.
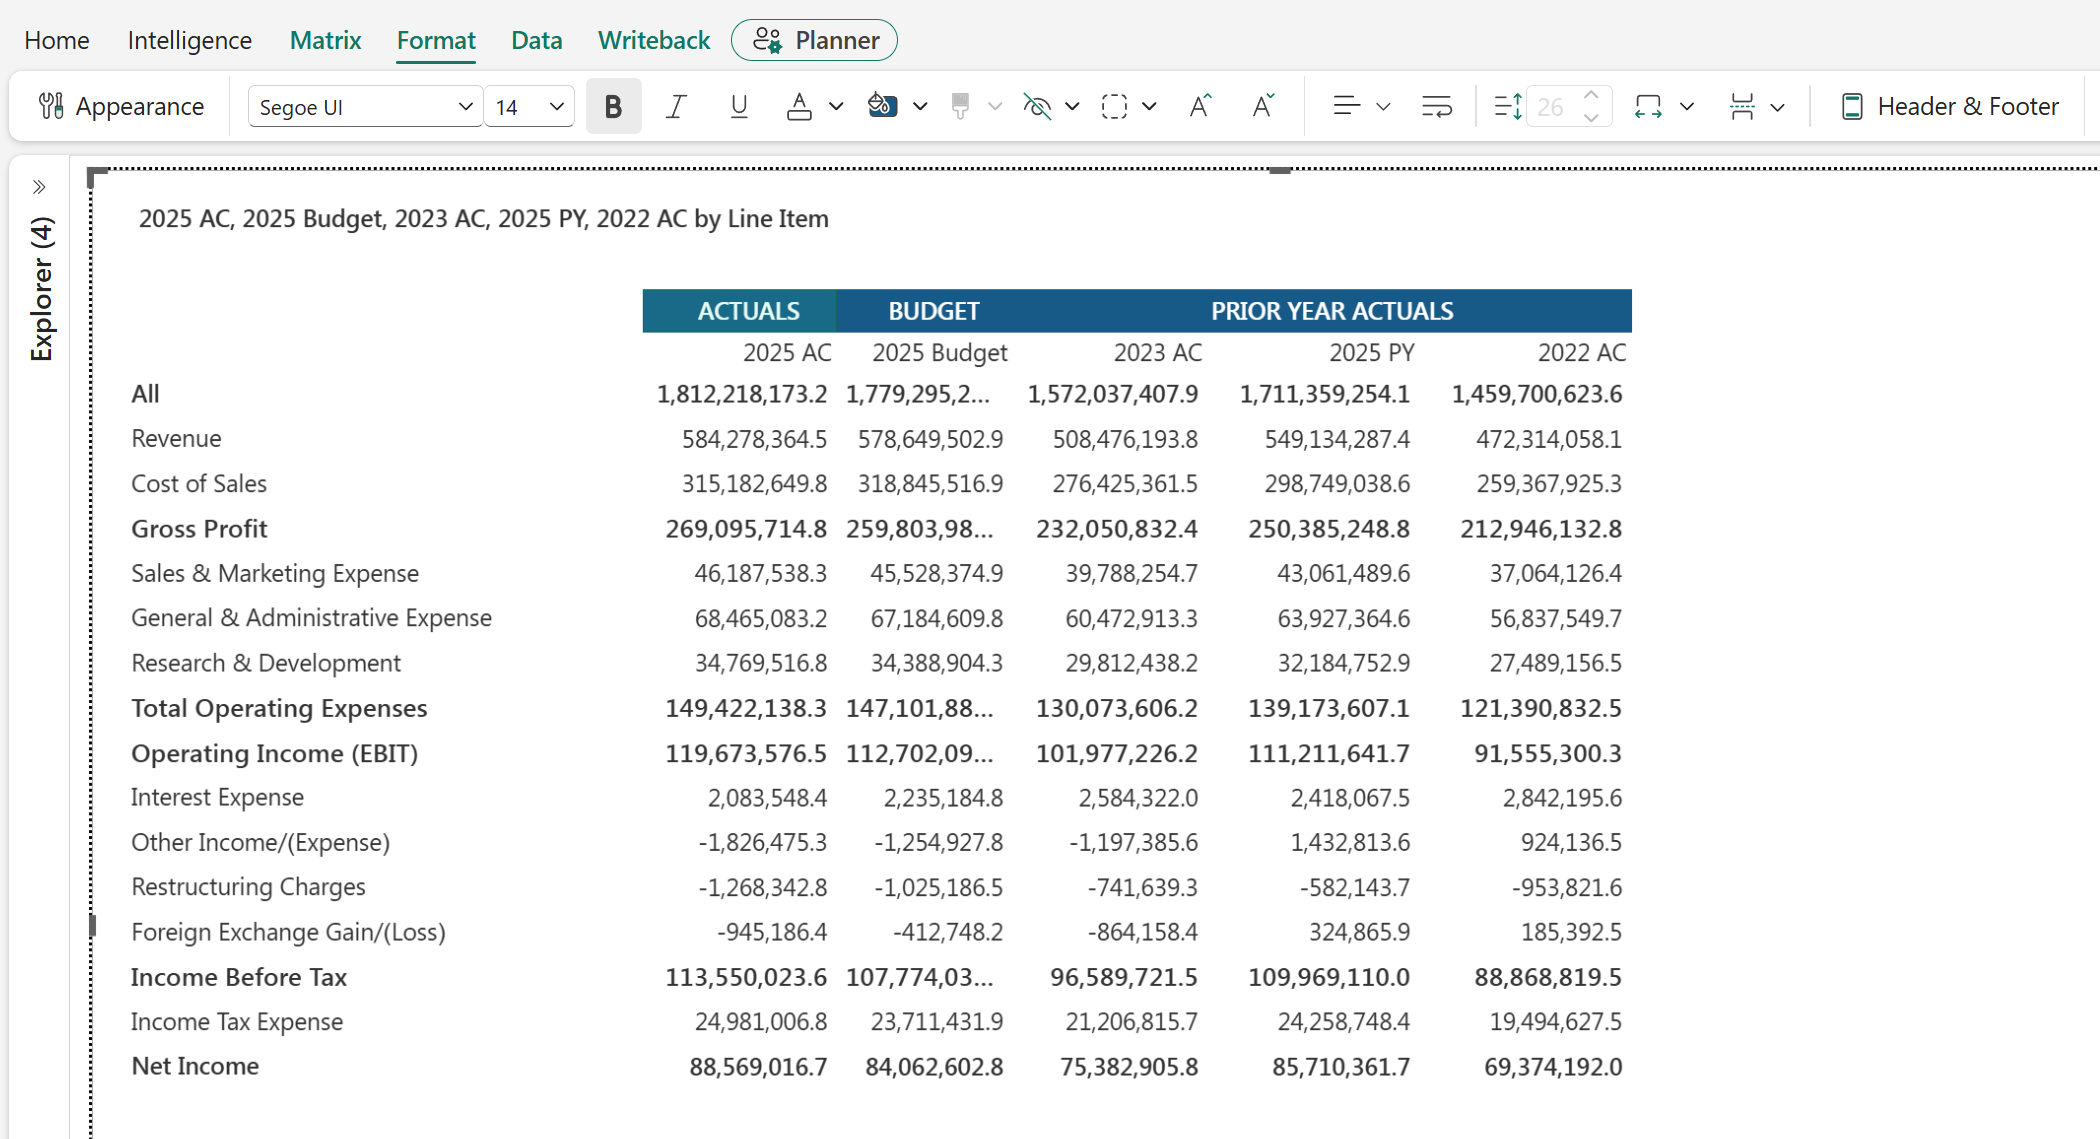
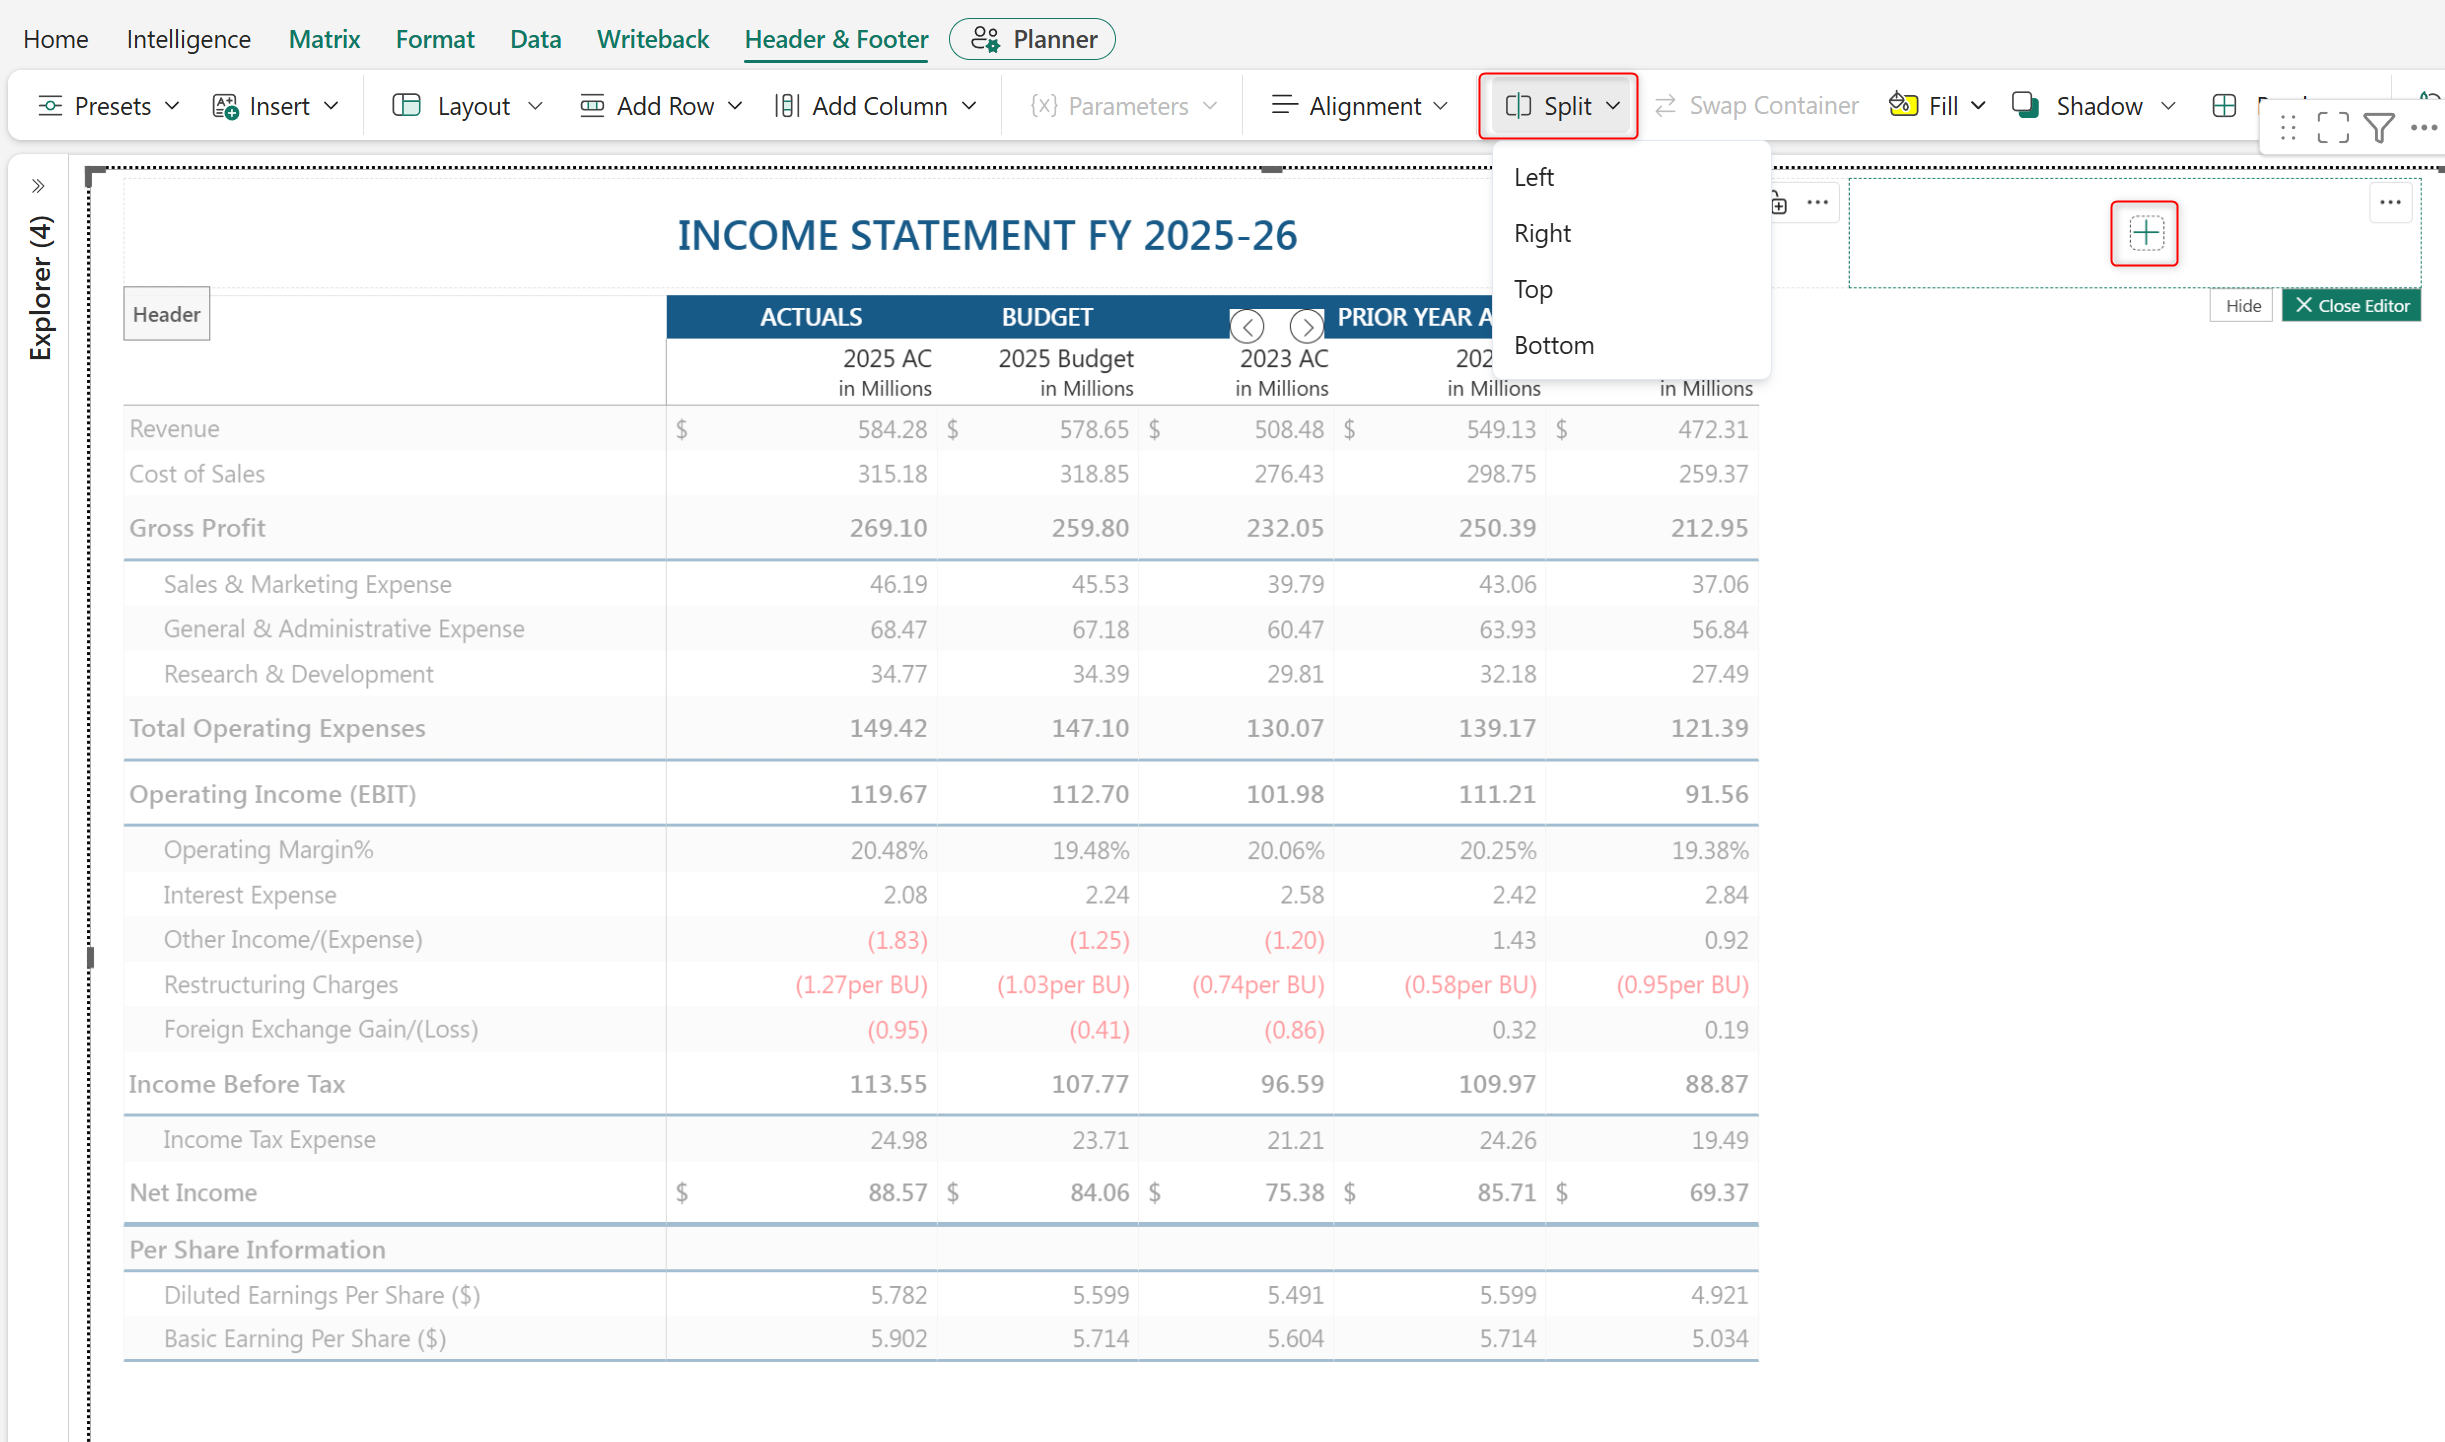
Create custom groups to combine related measures, such as prior year actuals, under a single header. Select the measures to group, and then in the Matrix ribbon, go to Layout > Group > Create Group. Enter the group name and select Apply.
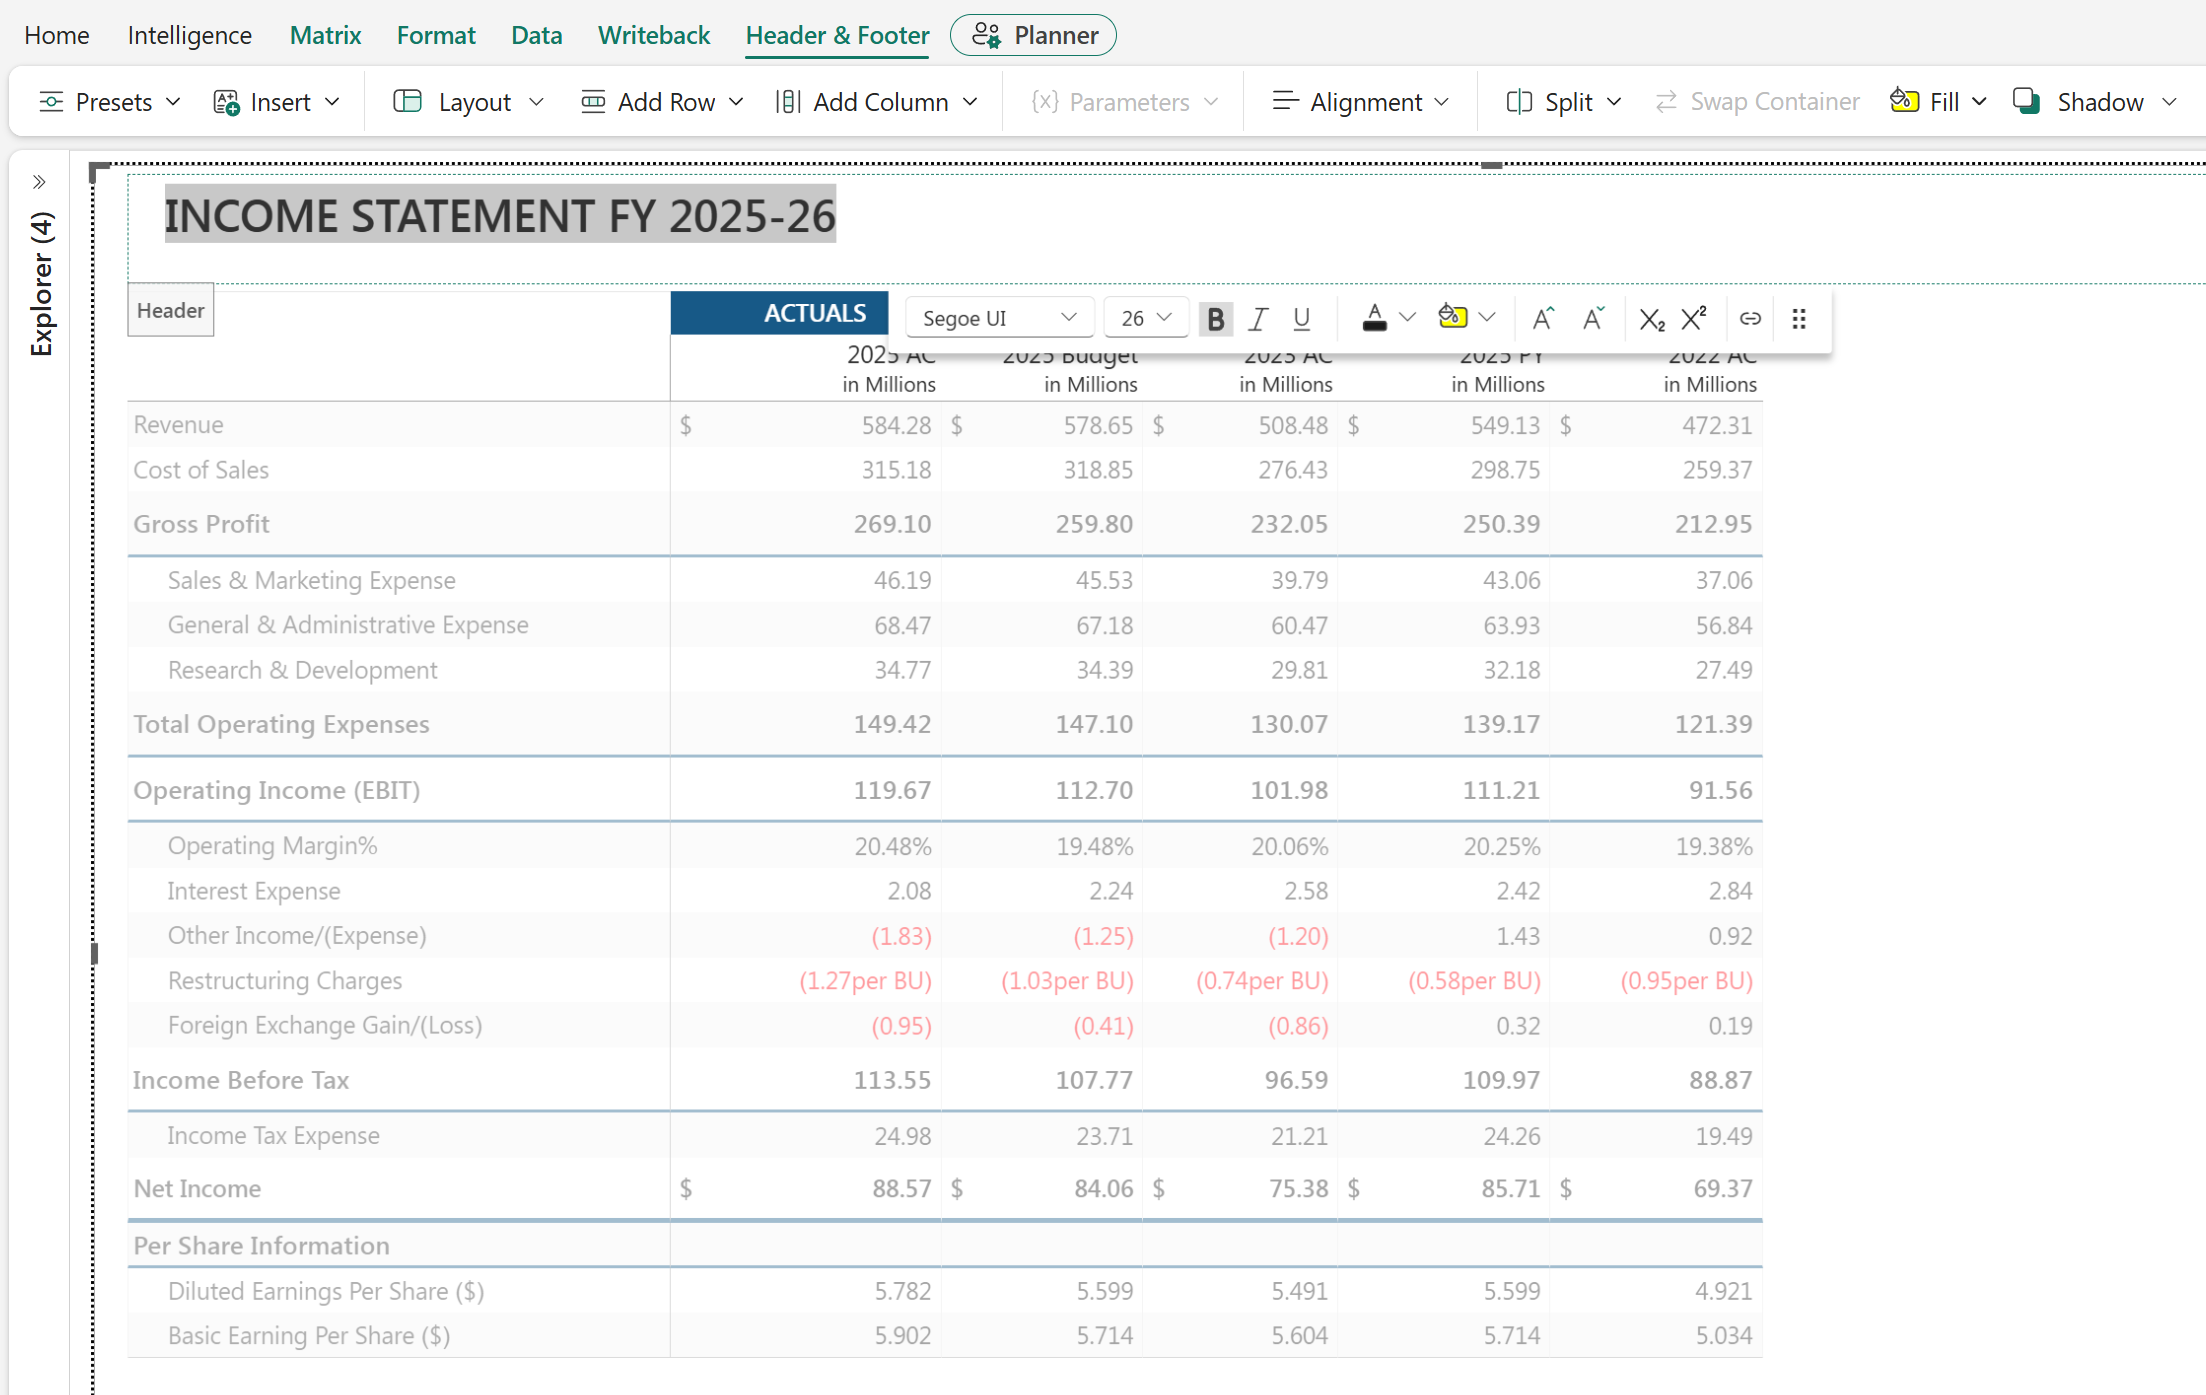
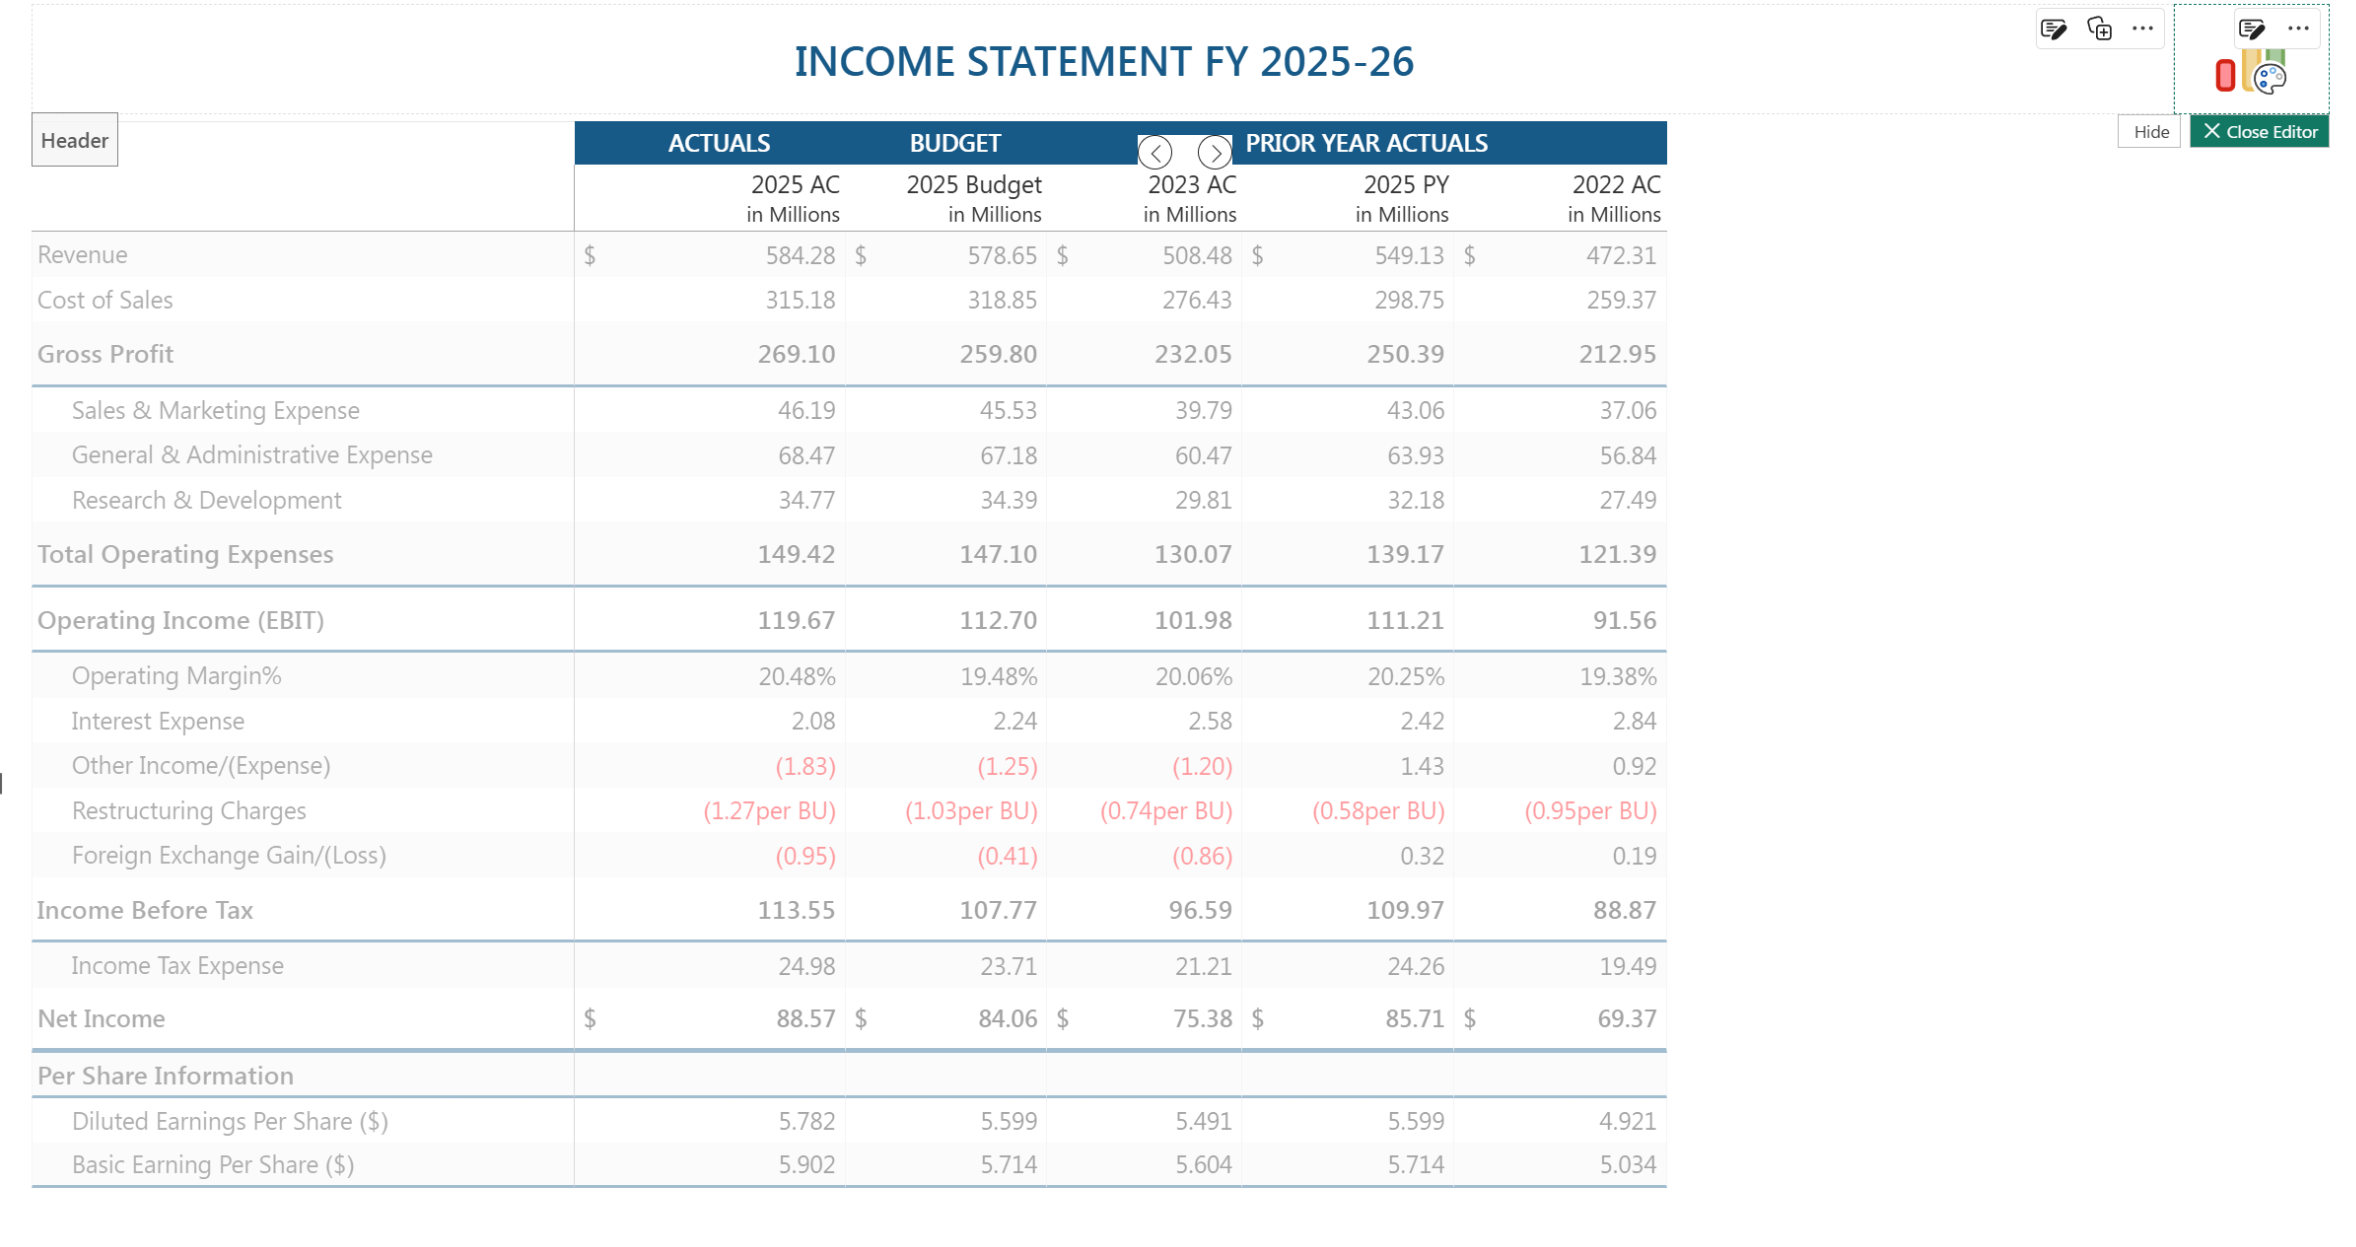
Select the header, and then go to the Format ribbon to customize the font and background color.
Highlight the total and subtotal rows with borders. Select the row, and then go to the Format ribbon and select the Border icon. Select Custom to define the border color, thickness, and position.
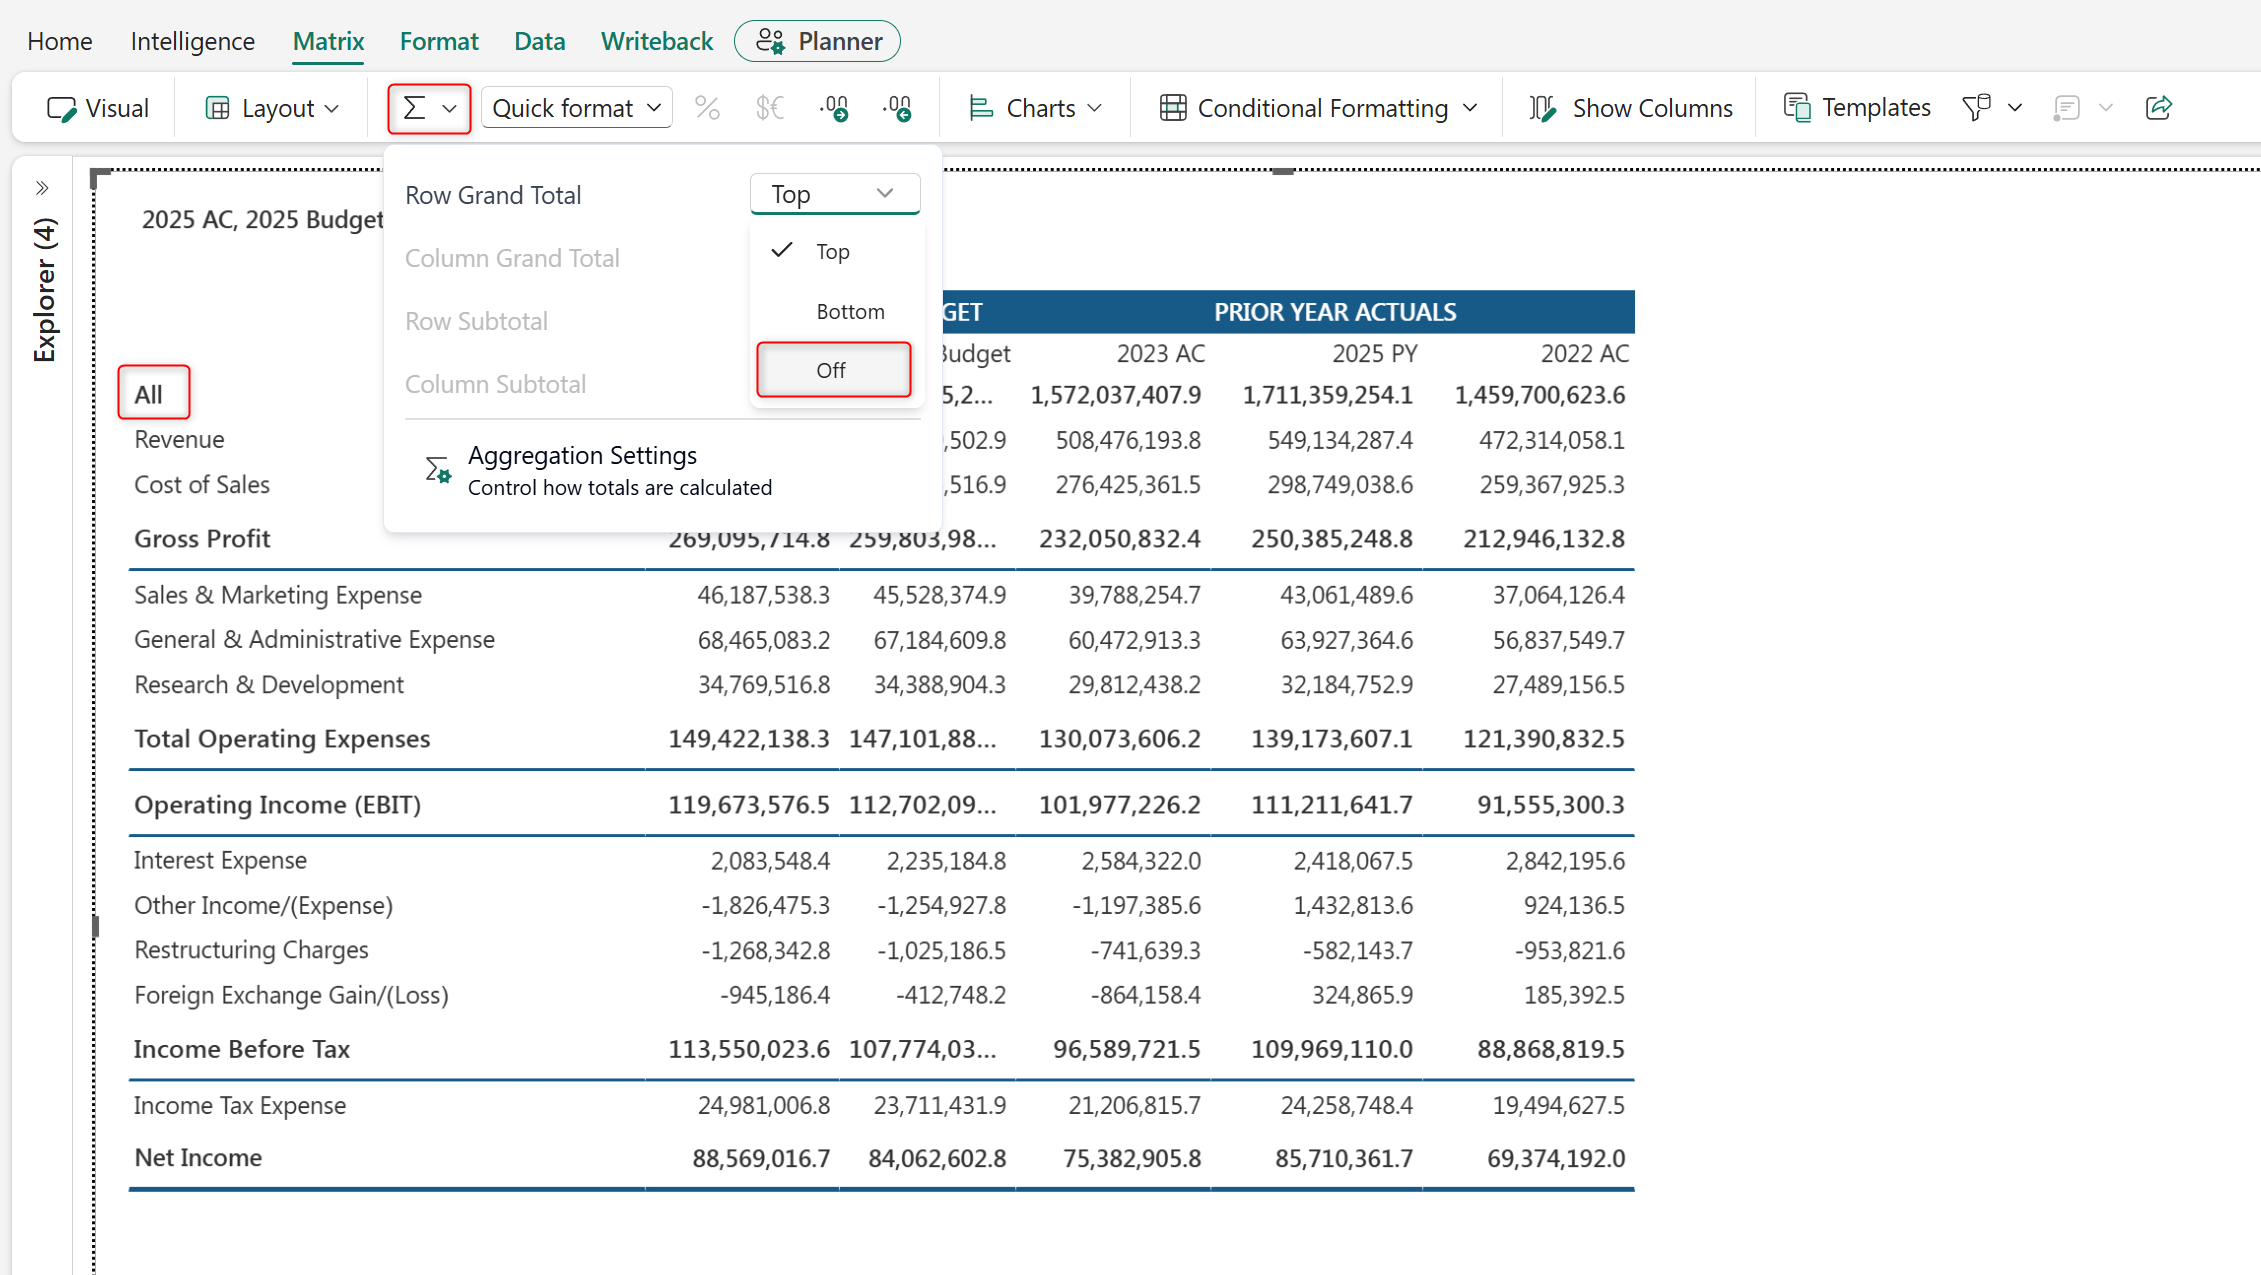
The intelligence sheet automatically calculates the grand totals. To hide the grand total row, in the Matrix ribbon, select Aggregation, then set Row Grand Total to Off.
Format numeric data in your reports by applying scaling, decimal precision, and prefixes to improve readability.
In the Matrix ribbon, select Quick Format to set number scaling at the report level. This setting applies to all the measures in your report.
For reports with mixed granularities, select a measure to apply a scaling factor only to that measure.
In the Matrix ribbon, select the decimal icons to increase or decrease the number of decimal places shown for all the measures in your report.
To adjust decimal places for a specific measure, select the measure and use the increase or decrease decimal icons.
Apply semantic formatting to ensure numeric values are displayed with consistent formats. In the Format ribbon, go to Appearance> Numbers and enable Semantic Formatting. Select the color and format to display positive and negative values. In this example, negative values are highlighted in red and shown in parentheses.
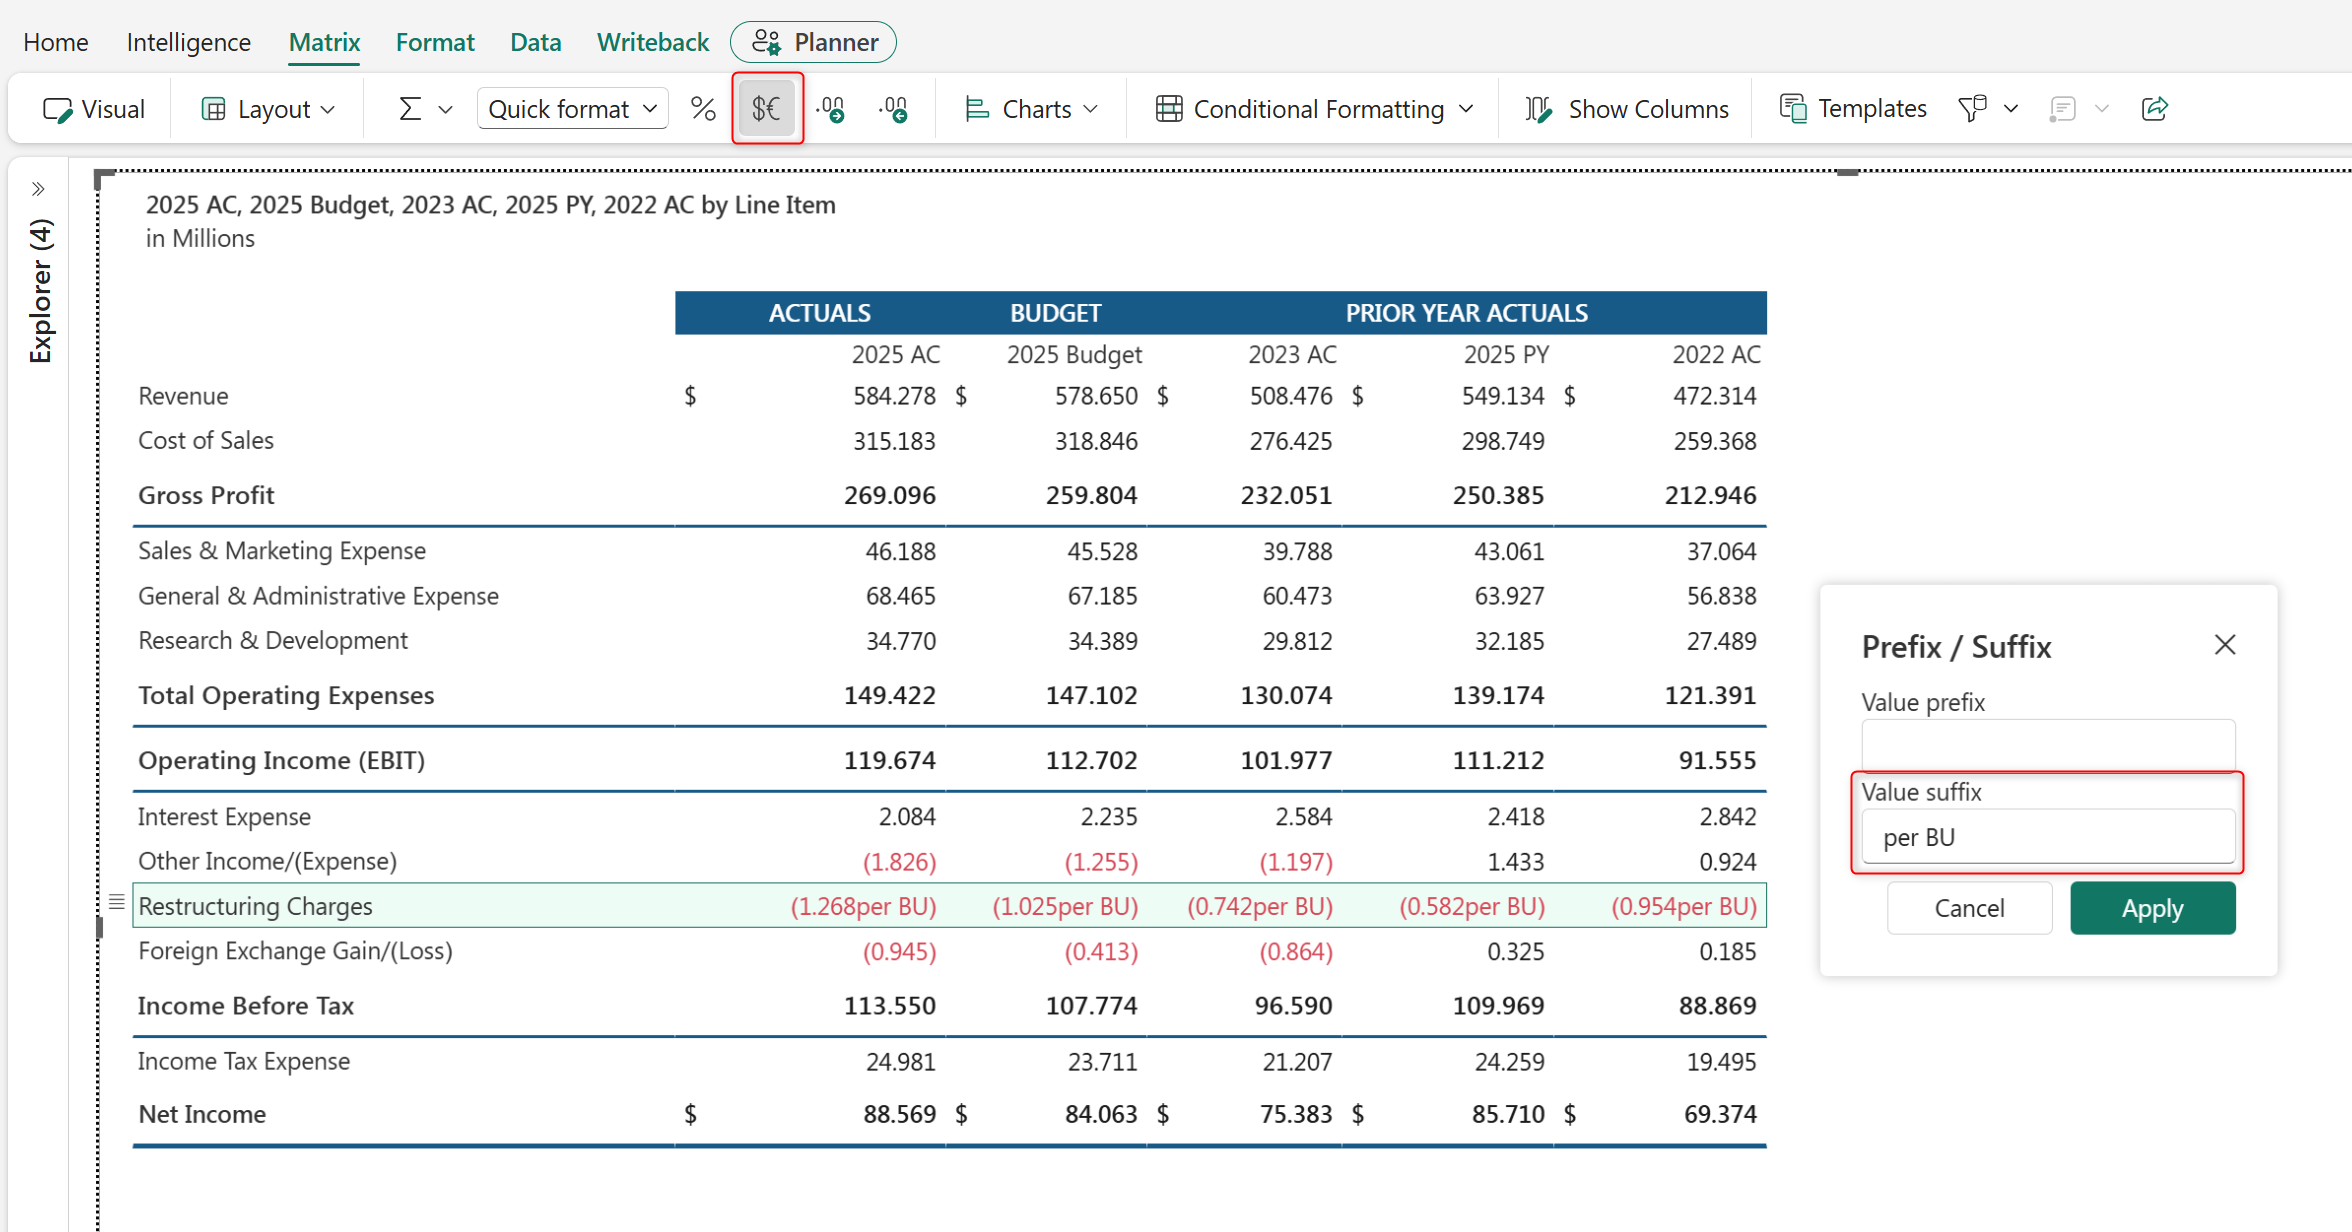
Apply prefixes and suffixes to provide context for financial values, such as currency symbols, units, or percentages. Select the required row or cell, then in the Matrix ribbon, select Prefix/Suffix and enter the required value.
For an income statement, calculated rows automatically derive key financial metrics from existing line items without manual calculations.
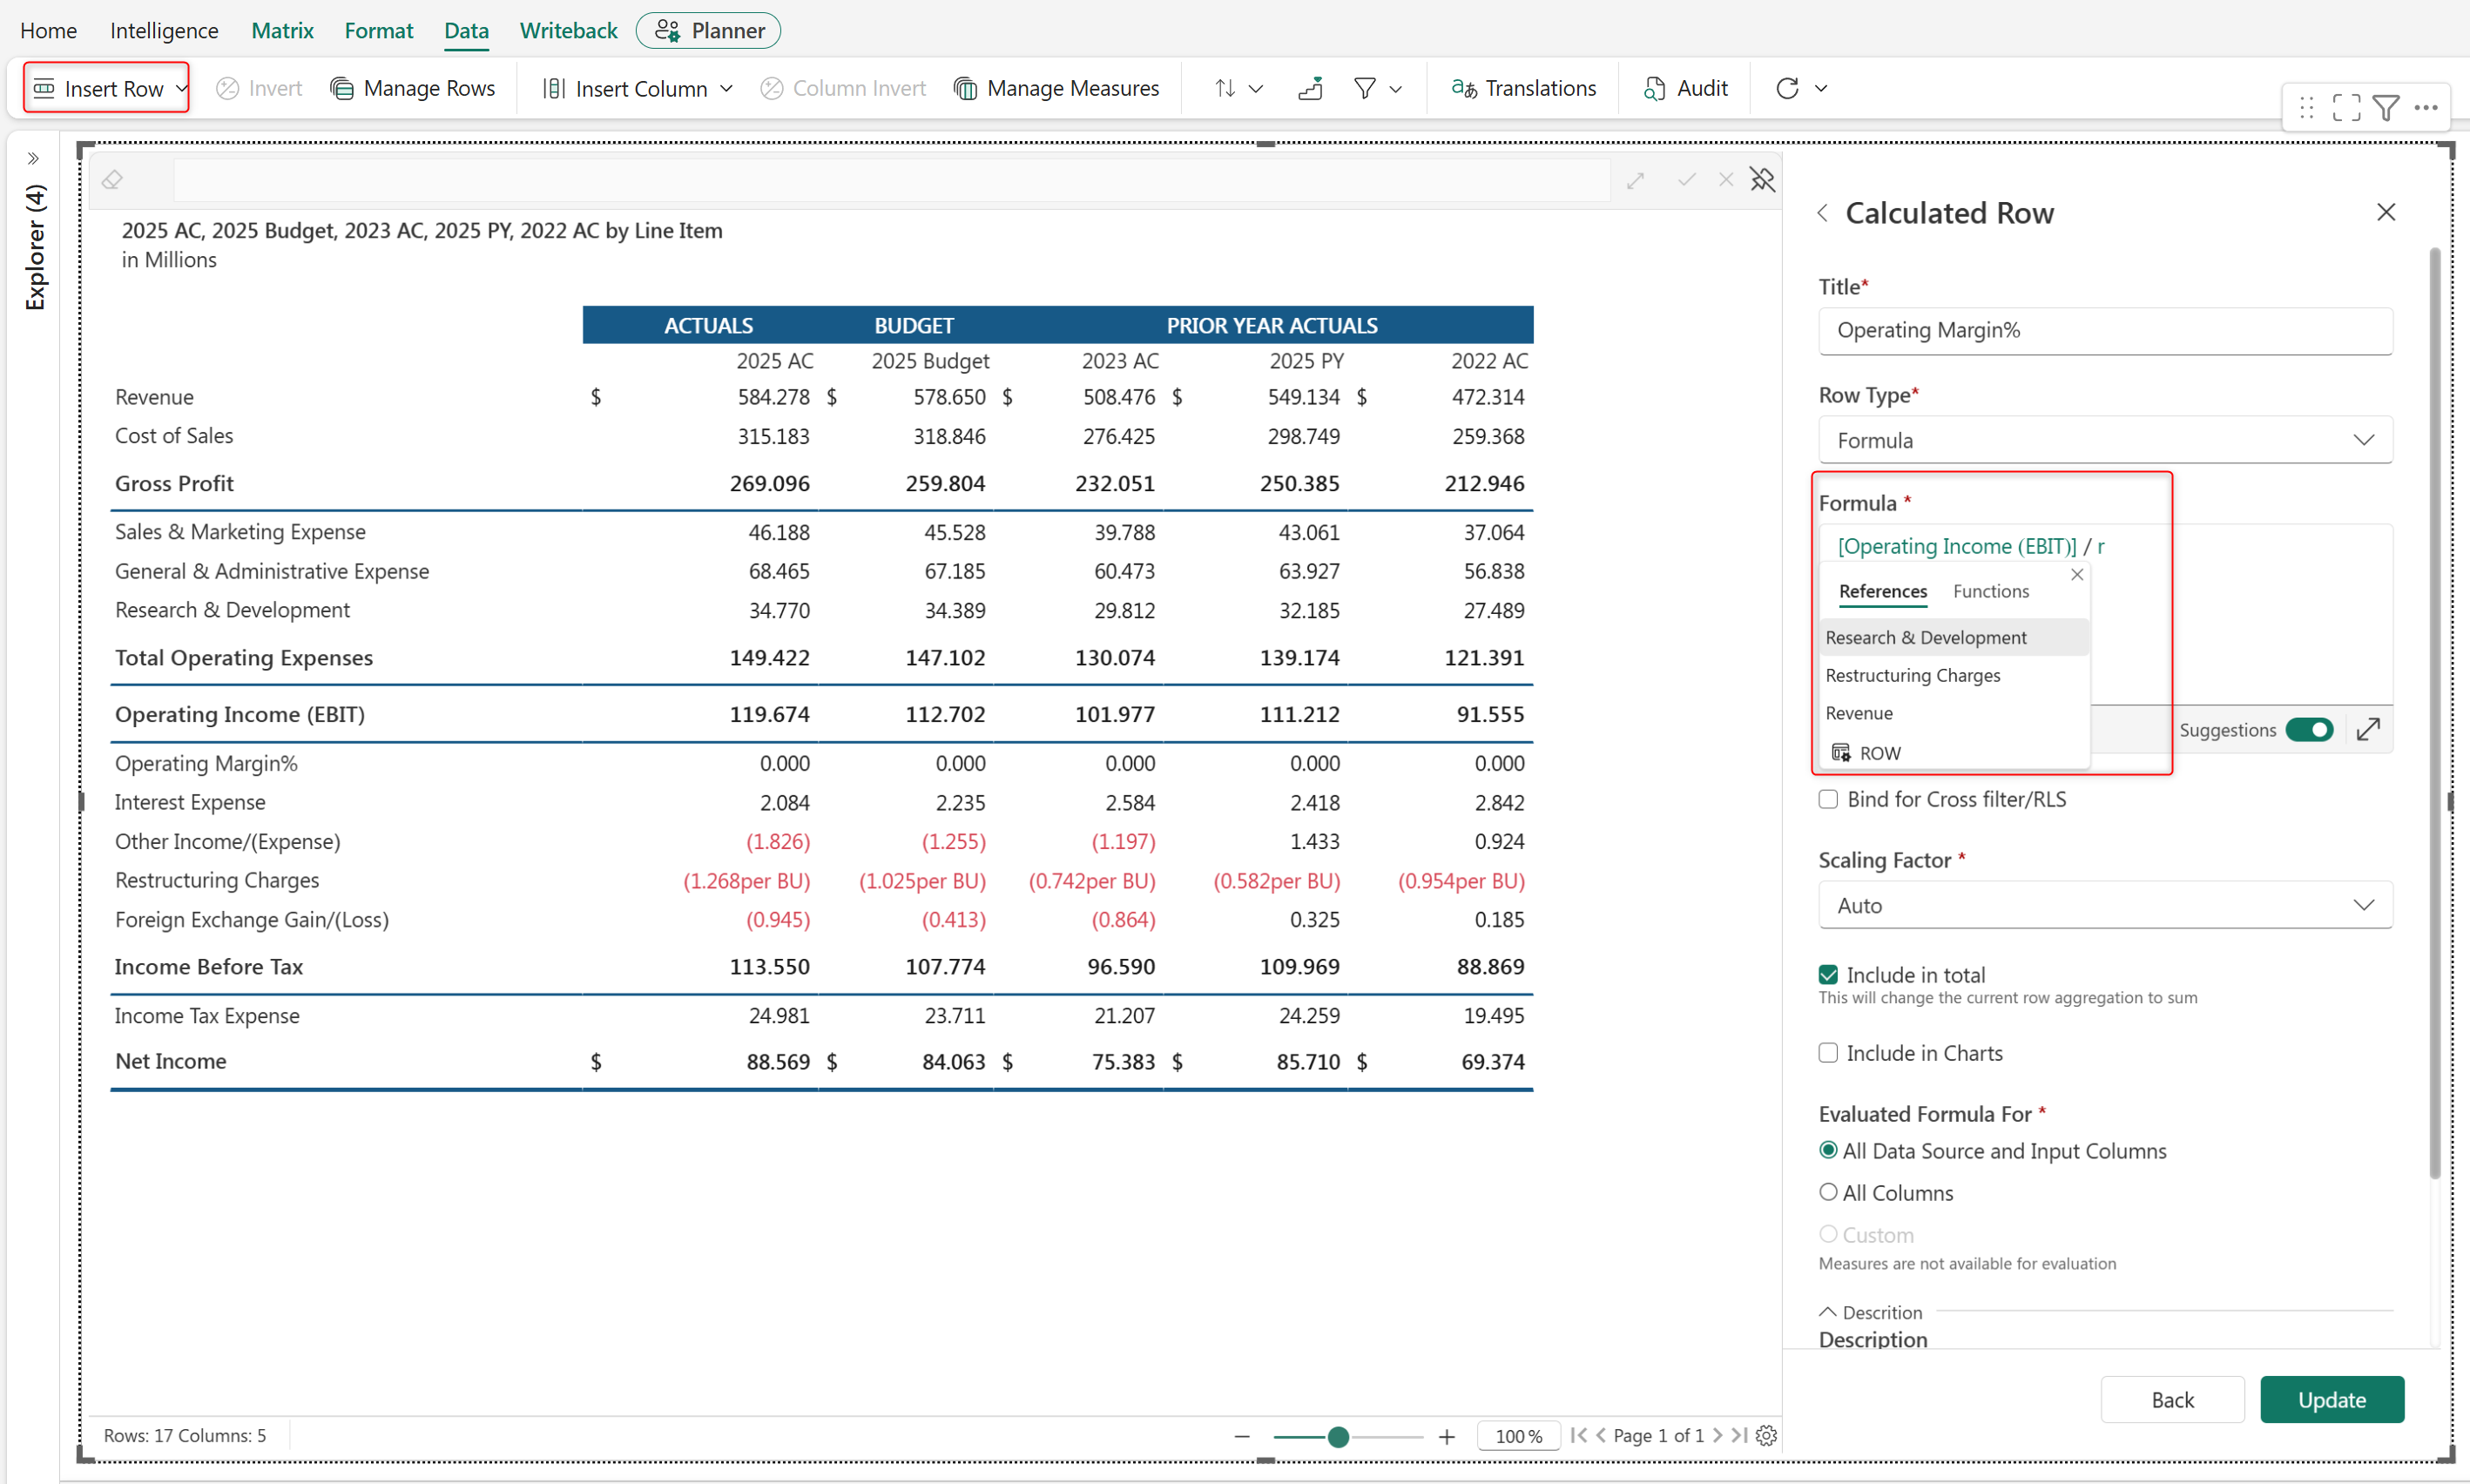
Select the row below which to insert a calculated row. In the Data ribbon, go to Insert Row and select Insert Formula.
Enter the calculation in the Formula section.
Press Ctrl + Space to open suggestions while writing a formula. This action helps you quickly discover available fields, functions, and syntax. Use dimensions and measures in your formula from the References tab.
To convert a value to a percentage, select the row and select the percentage icon in the Matrix ribbon.