Calculates the exclusive percentile of a dataset to find the value below which a given percentage of data falls.
The PERCENTILEEXC function returns the k-th percentile of a dataset using the exclusive method, requiring k to be between 0 and 1 (exclusive), excluding the minimum and maximum values from the calculation.
PERCENTILEEXC(array, k)The PERCENTILEEXC function syntax has the following arguments:
PERCENTILEEXC(10,20,30,40,50,60,70,80, 0.25)
// Returns 22.5
PERCENTILEEXC(10,20,30,40,50,60,70,80, 0.5)
// Returns 45
PERCENTILEEXC(10,20,30,40,50,60,70,80, 0.75)
// Returns 67.5
You can use the PERCENTILEEXC function to determine the relative standing of values within a dataset by calculating exclusive percentiles for metrics such as sales, revenue, or performance scores, especially when working with sample data.
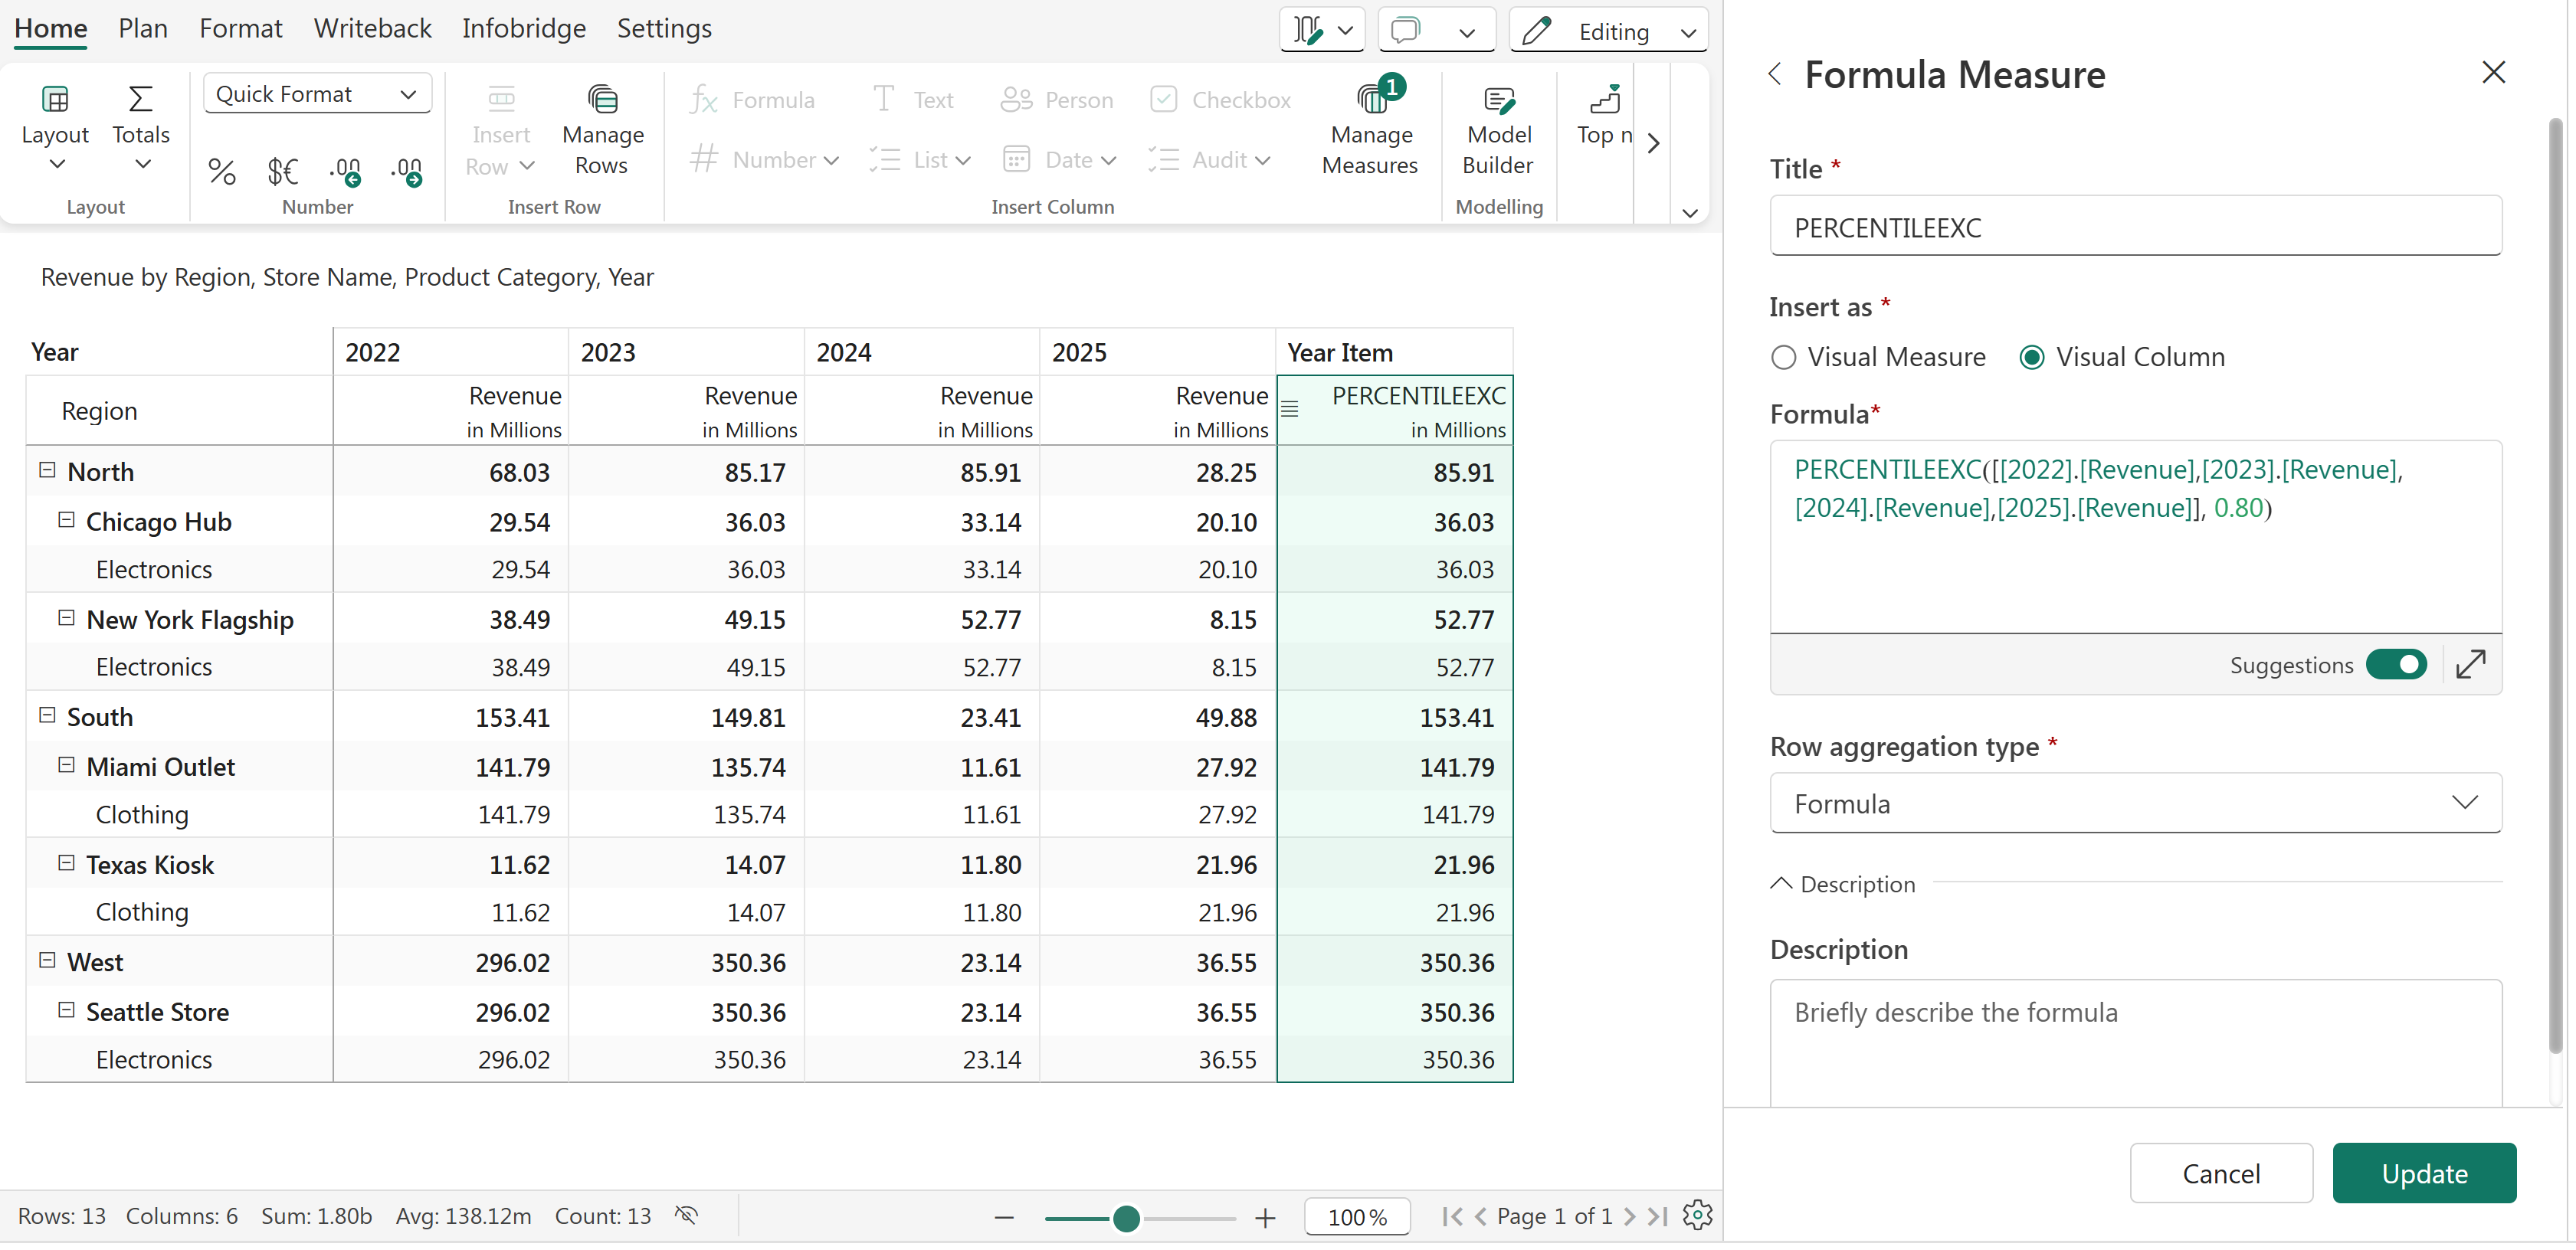
PERCENTILEEXC function
We can also use the SELECT function to select a range of columns from 1 to 4 for the 'Revenue' measure (2022 Revenue - 2025 Revenue)
PERCENTILEEXC(SELECT([Revenue], 1, 4), 0.80)
Q1. How is PERCENTILEEXC calculated?
PERCENTILEEXC is calculated by determining the k-th percentile of a dataset using the exclusive method, which excludes the minimum and maximum values from the calculation.

Where:
If the calculated position is not a whole number, the result is obtained by interpolating between the surrounding values. It returns the value below which a specified percentage of data falls, excluding both the minimum and maximum values.
Q2. What does a percentile represent?
A percentile shows how a value compares to other values in a dataset.
For example, consider student exam scores. If a student’s score is at the 90th percentile:
This means the student performed better than most of the class and is among the top 10%.


