Learn how to create Top N rankings in dashboards to highlight best- and worst-performing metrics
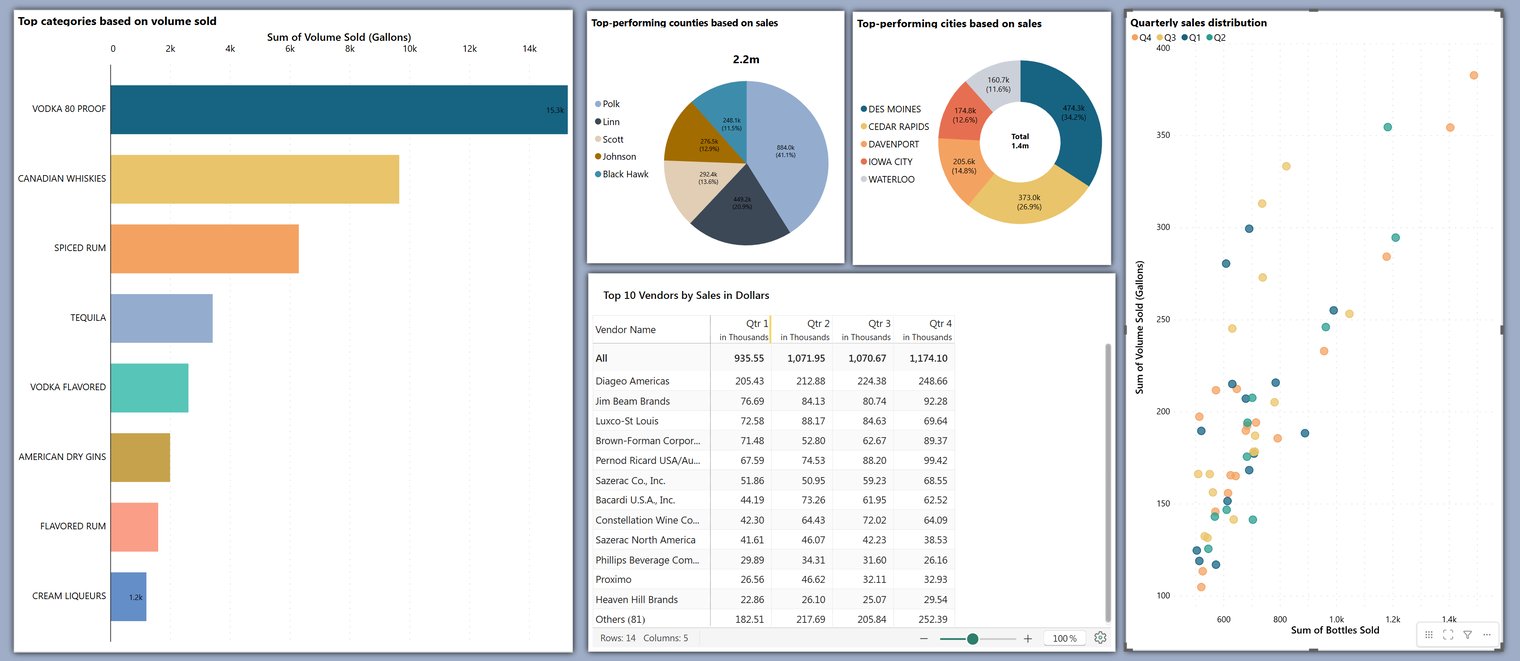

Display the top or bottom performing categories


Configure ranking from the Axis tab. All categories are plotted when Display is set to Off.

Define the number of categories to display the highest or lowest contributors.

You can rank based on rows or columns for charts and tables in trellis mode. The Top N interface has a row and column tab for trellises. Follow the steps outlined in the setup section in each of these tabs.
Let's use TopN ranking to find the regions and product categories with the least sales.

The top or bottom performing categories are rendered.

Apply Top N ranking to stacked charts to display only the top or bottom performing categories. The steps outlined in the setup section can be applied in the Stacked tab. The images show how ranking can be used to display the top-performing stacked categories.
Apply ranking from the Stacked tab.

Best performing segments are rendered:



