Calculate quartiles using the exclusive method to understand data distribution.
The QUARTILEEXC function divides a dataset into four equal parts and returns a value based on the specified quartile. It uses the exclusive method, meaning the minimum and maximum values are excluded from the calculation, helping you understand how data is distributed across ranges.
QUARTILEEXC(array, quart)The QUARTILEINC function syntax has the following arguments:
Unlike QUARTILEINC, 0 (Minimum) and 4 (Maximum) are not valid inputs in the exclusive method.
QUARTILEEXC(10,20,30,40,50,60,70,80, 1)
// Returns 22.5
QUARTILEEXC(10,20,30,40,50,60,70,80, 2)
// Returns 45
QUARTILEEXC(10,20,30,40,50,60,70,80, 3)
// Returns 67.5
You can use the QUARTILEEXC function to analyze the distribution of a dataset by dividing values into four equal parts for metrics such as sales, revenue, or performance scores.
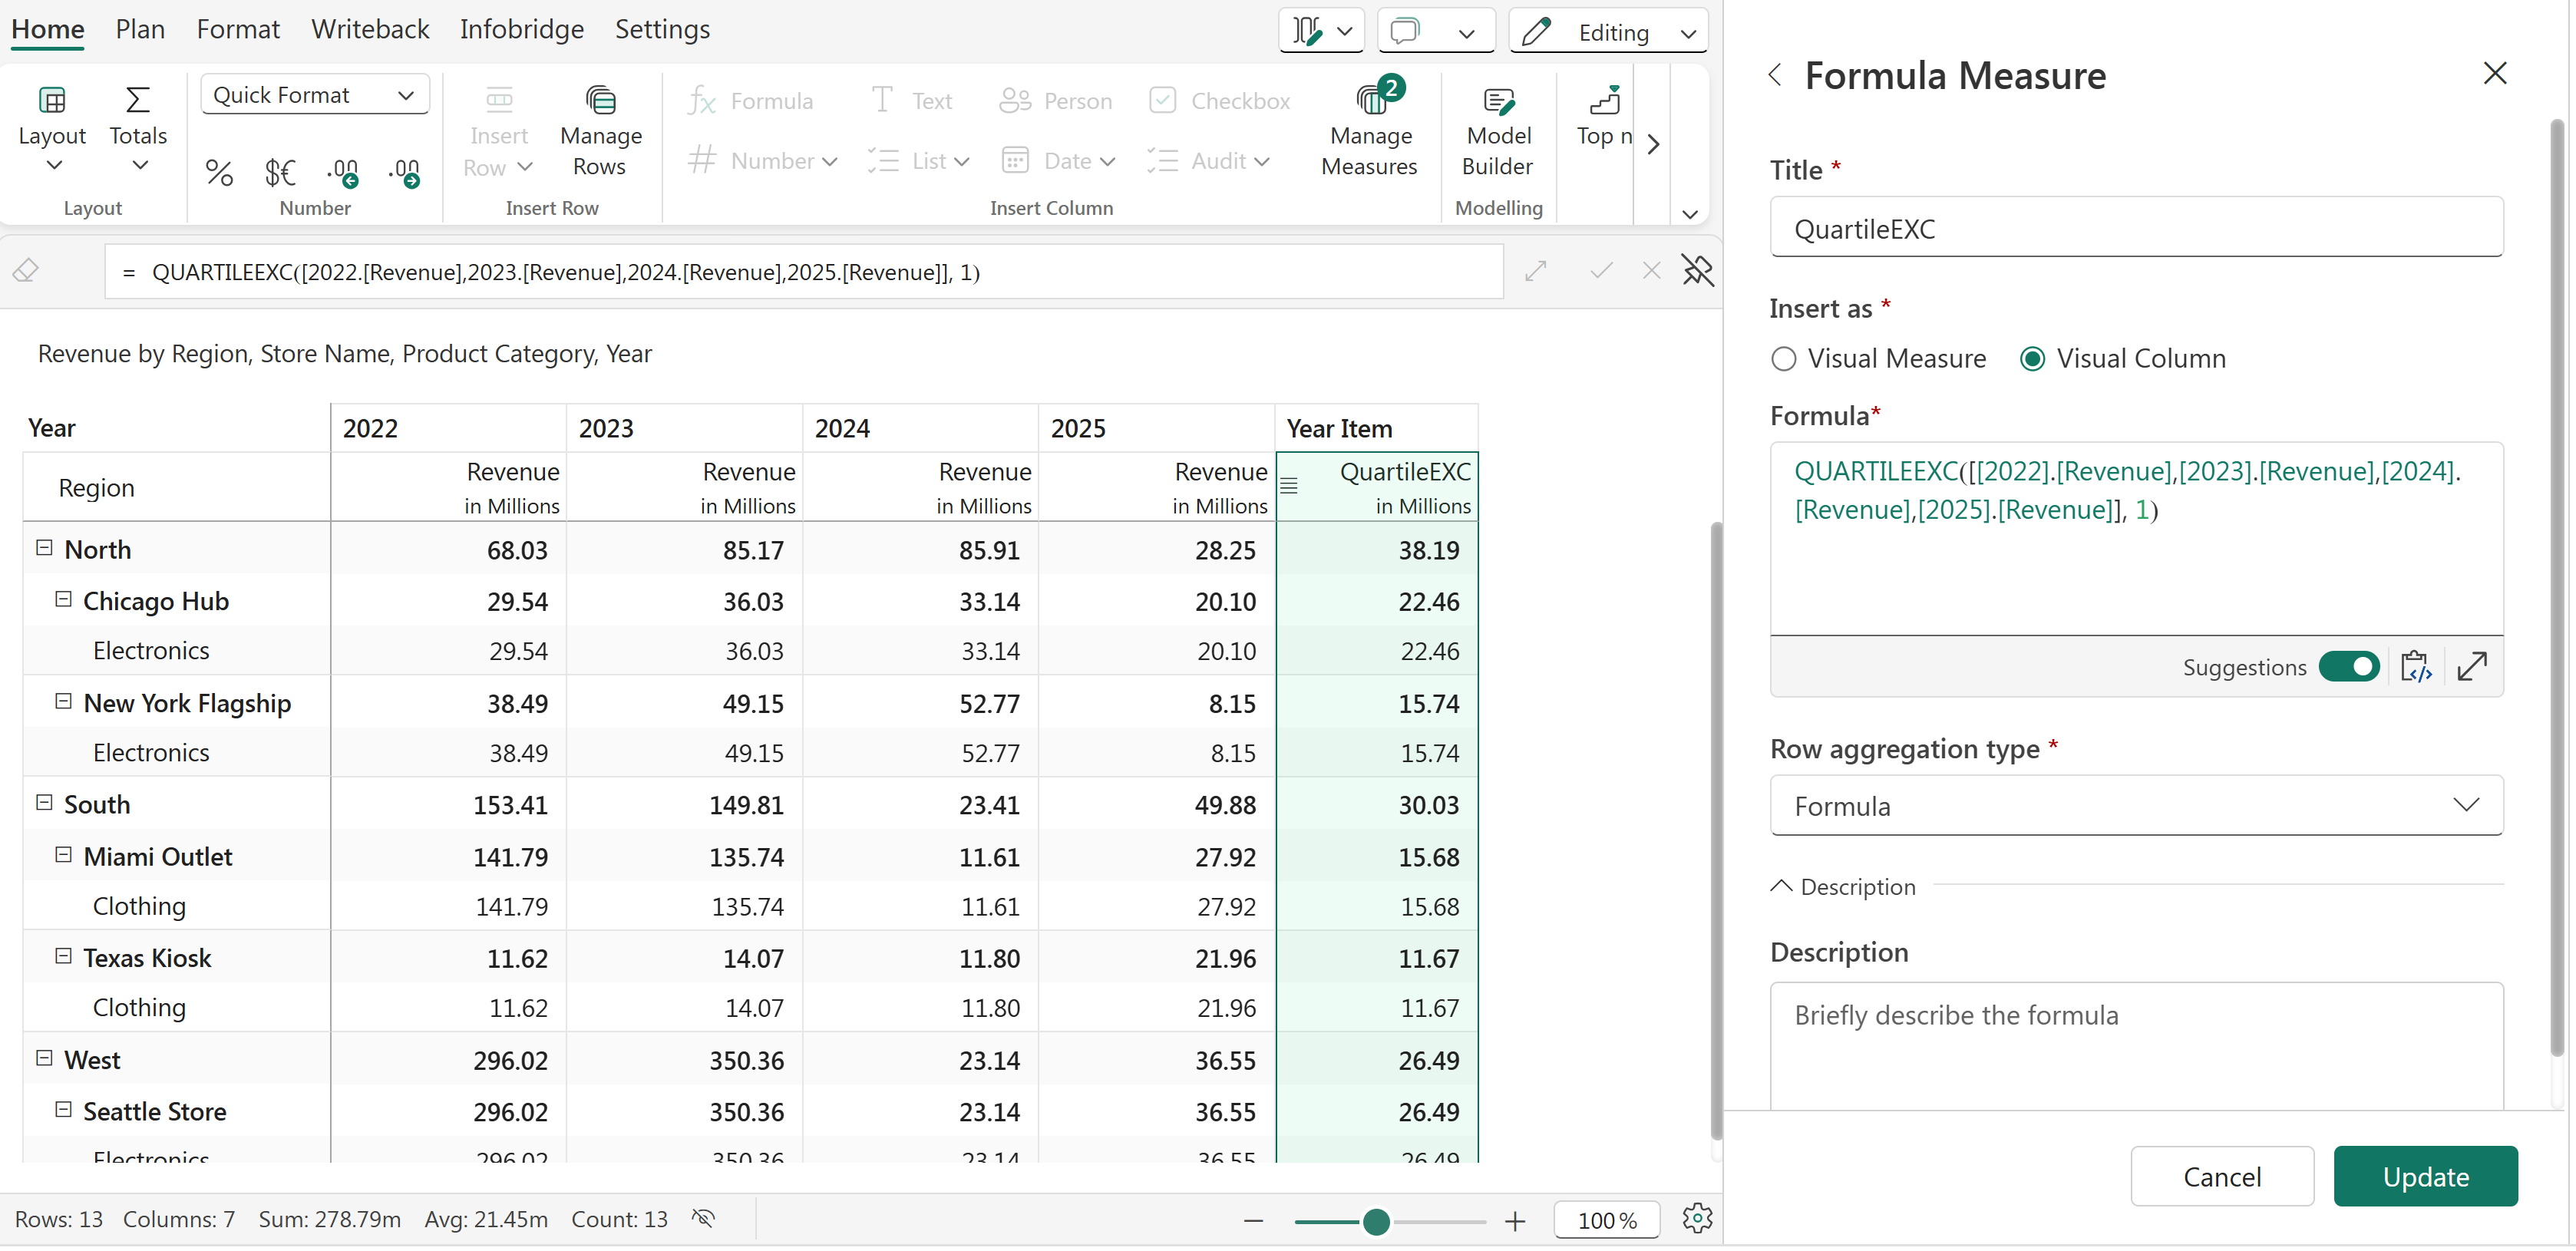
QUARTILEEXC function
We can also use the SELECT function to select a range of columns from 1 to 4 for the 'Revenue' measure (2022 Revenue - 2025 Revenue).
QUARTILEEXC(SELECT([Revenue], 1, 4), 3)
Q1. What do quartiles represent?


