Export reports and dashboards as high-quality files while preserving layout and formatting. Export options allow you to:
- Export charts, tables, and dashboards as PDF or PNG files.
- Preserve report formatting, including fonts, colors, spacing, and layout.
- Select the quality and page size.
Important
This feature is in preview.
Export to PDF
Charts and KPI cards can be exported to PDF or PNG files.
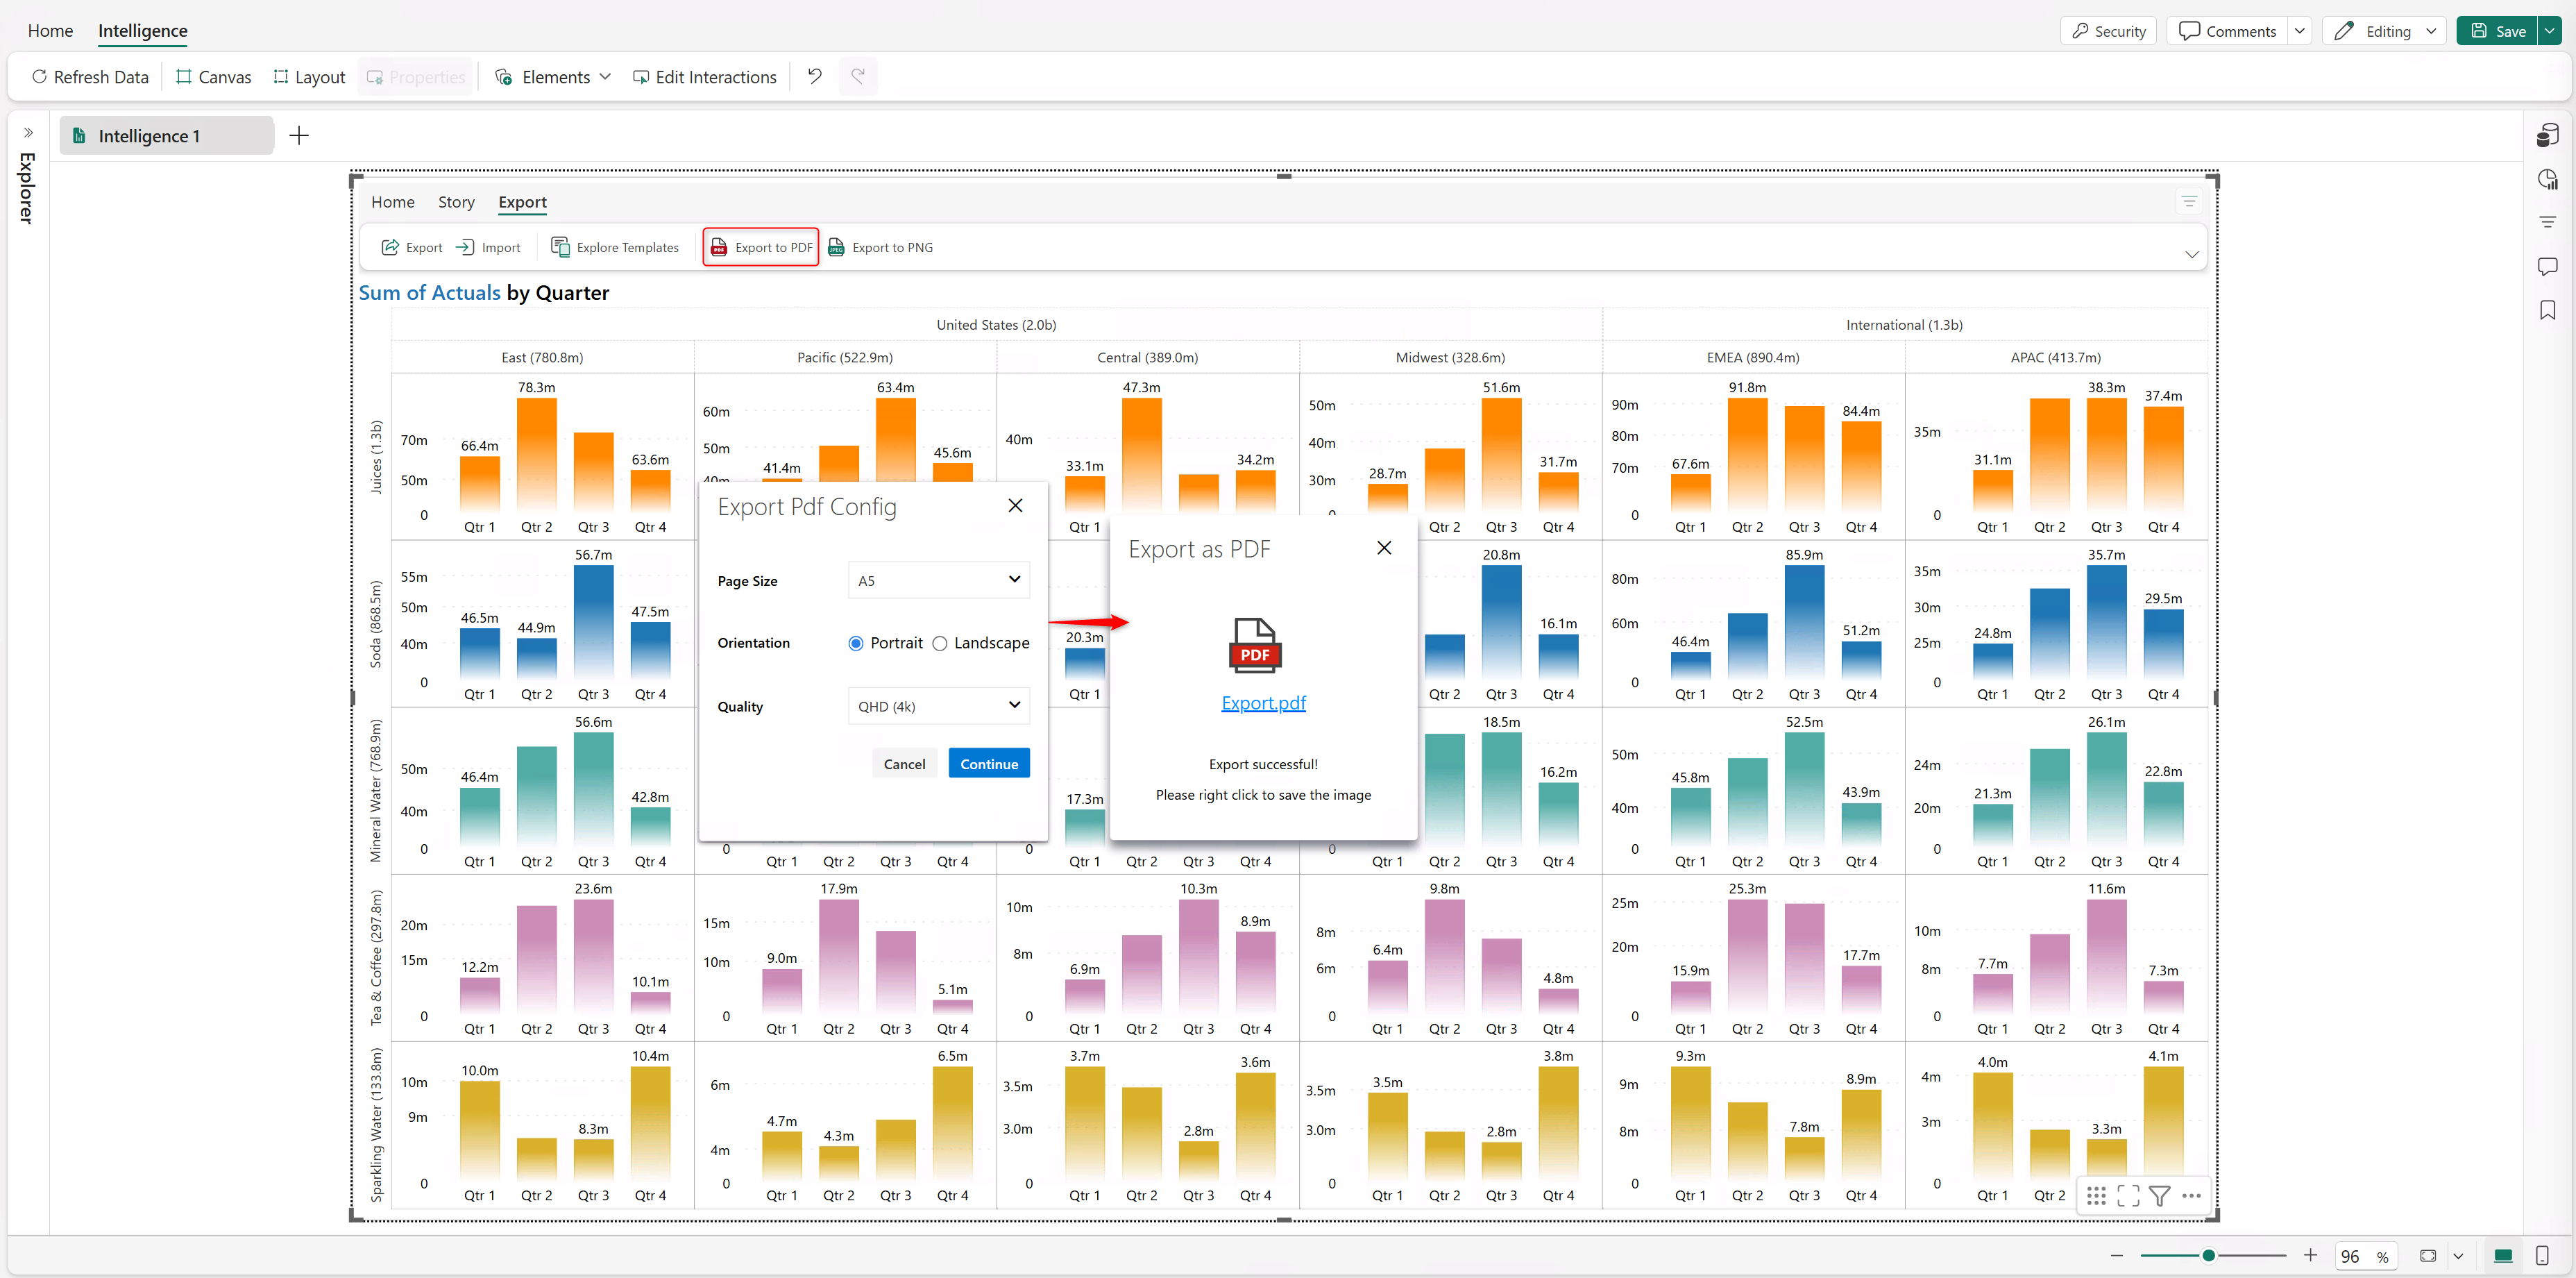
- Select Export to PDF.
- Set the Page Size.
- Choose Landscape or Portrait orientation.
- Select the export resolution (4K/1080p/720p).
- Select the link to download the PDF file.
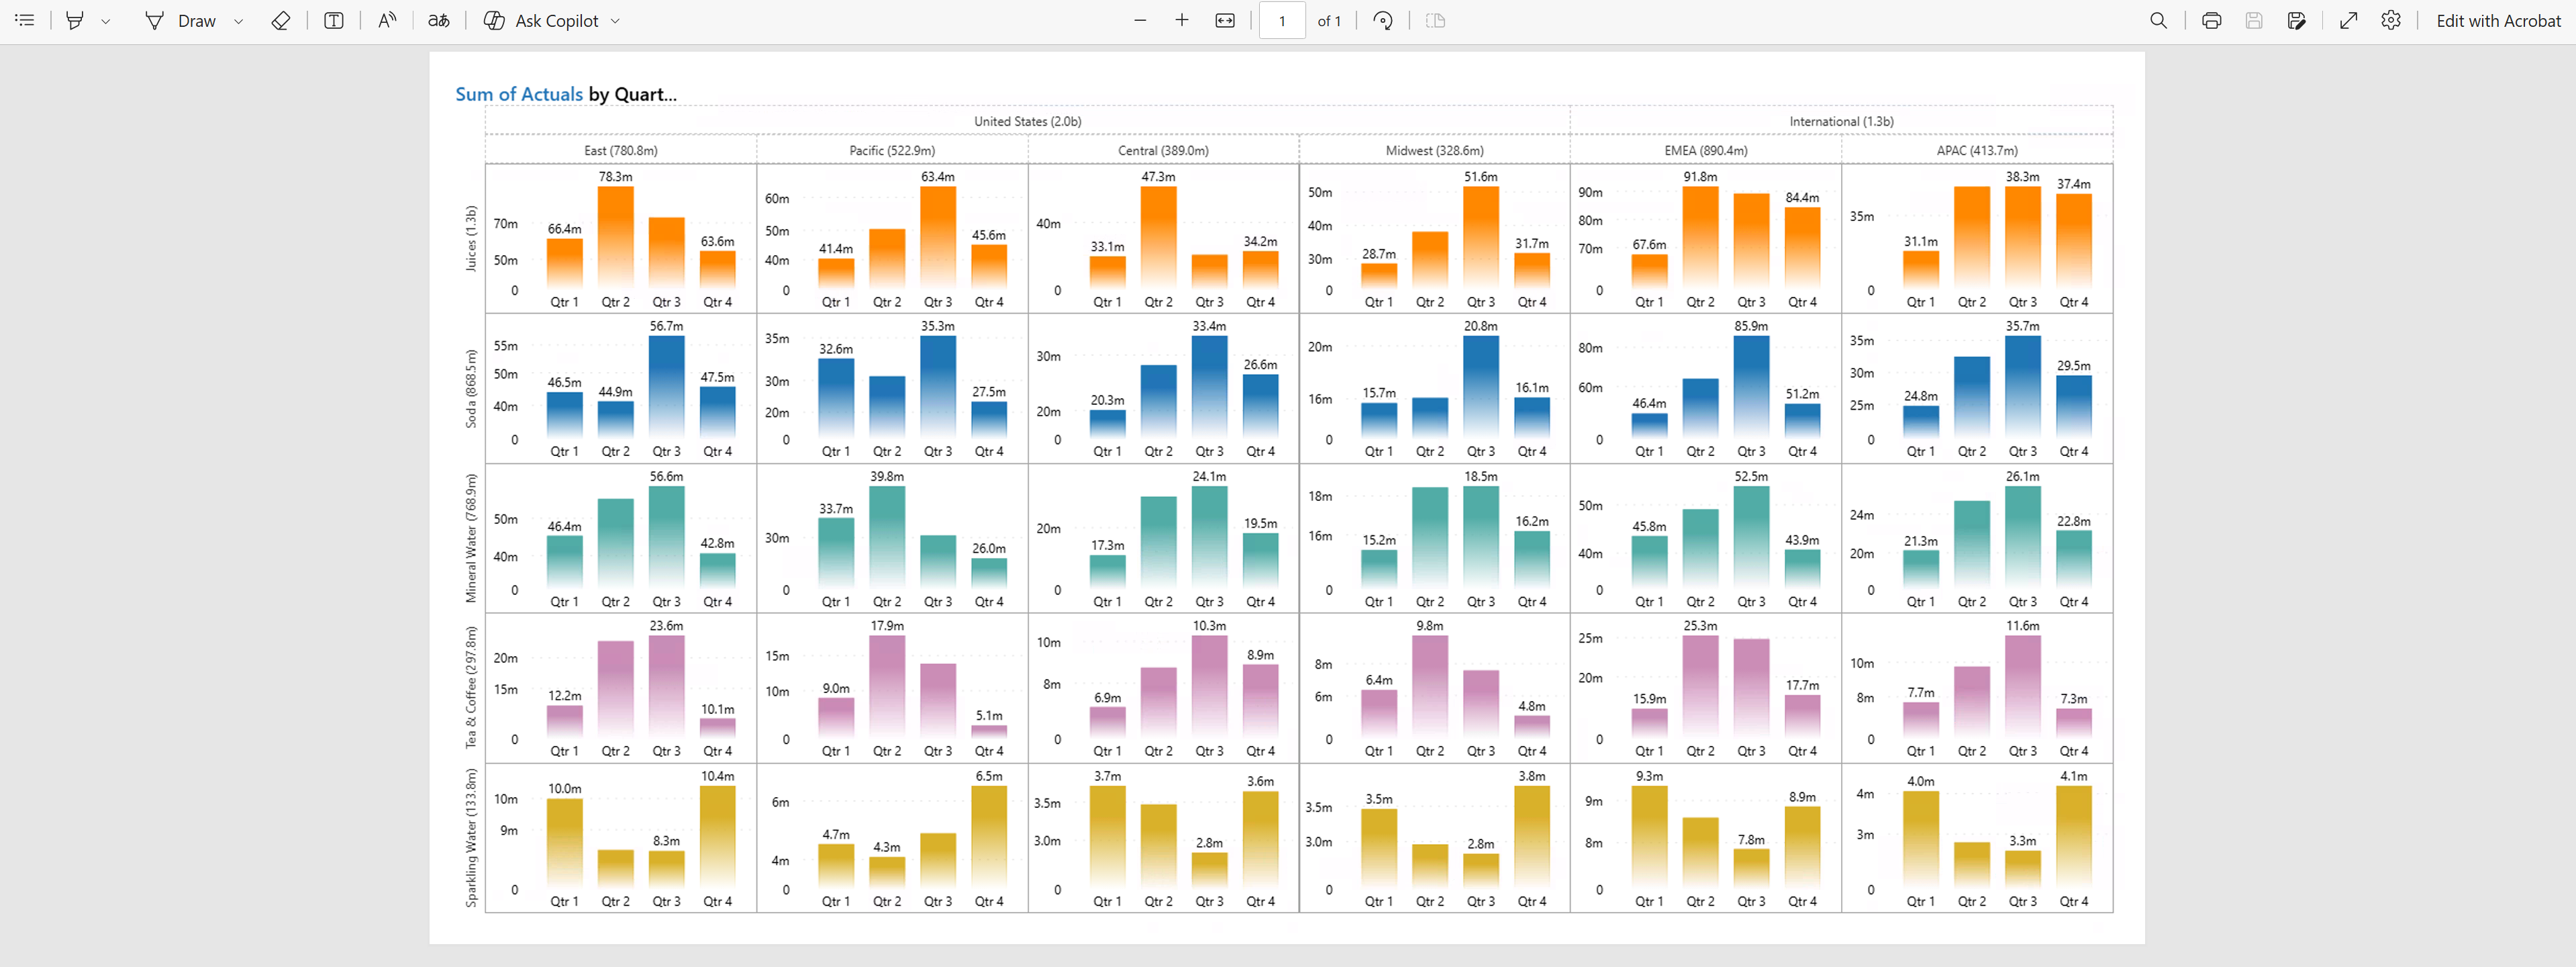
The following image shows a sample PDF export:
Export to Excel
Tabular reports can be exported to Excel with fully preserved conditional formatting.
- Select the columns in your report to export only those columns. By default, the entire matrix is exported.
- Select the Export icon on the Home tab of the menu ribbon.

- Select Excel format.
- Choose Selected Columns (this exports a portion of the report).
- Click Export.
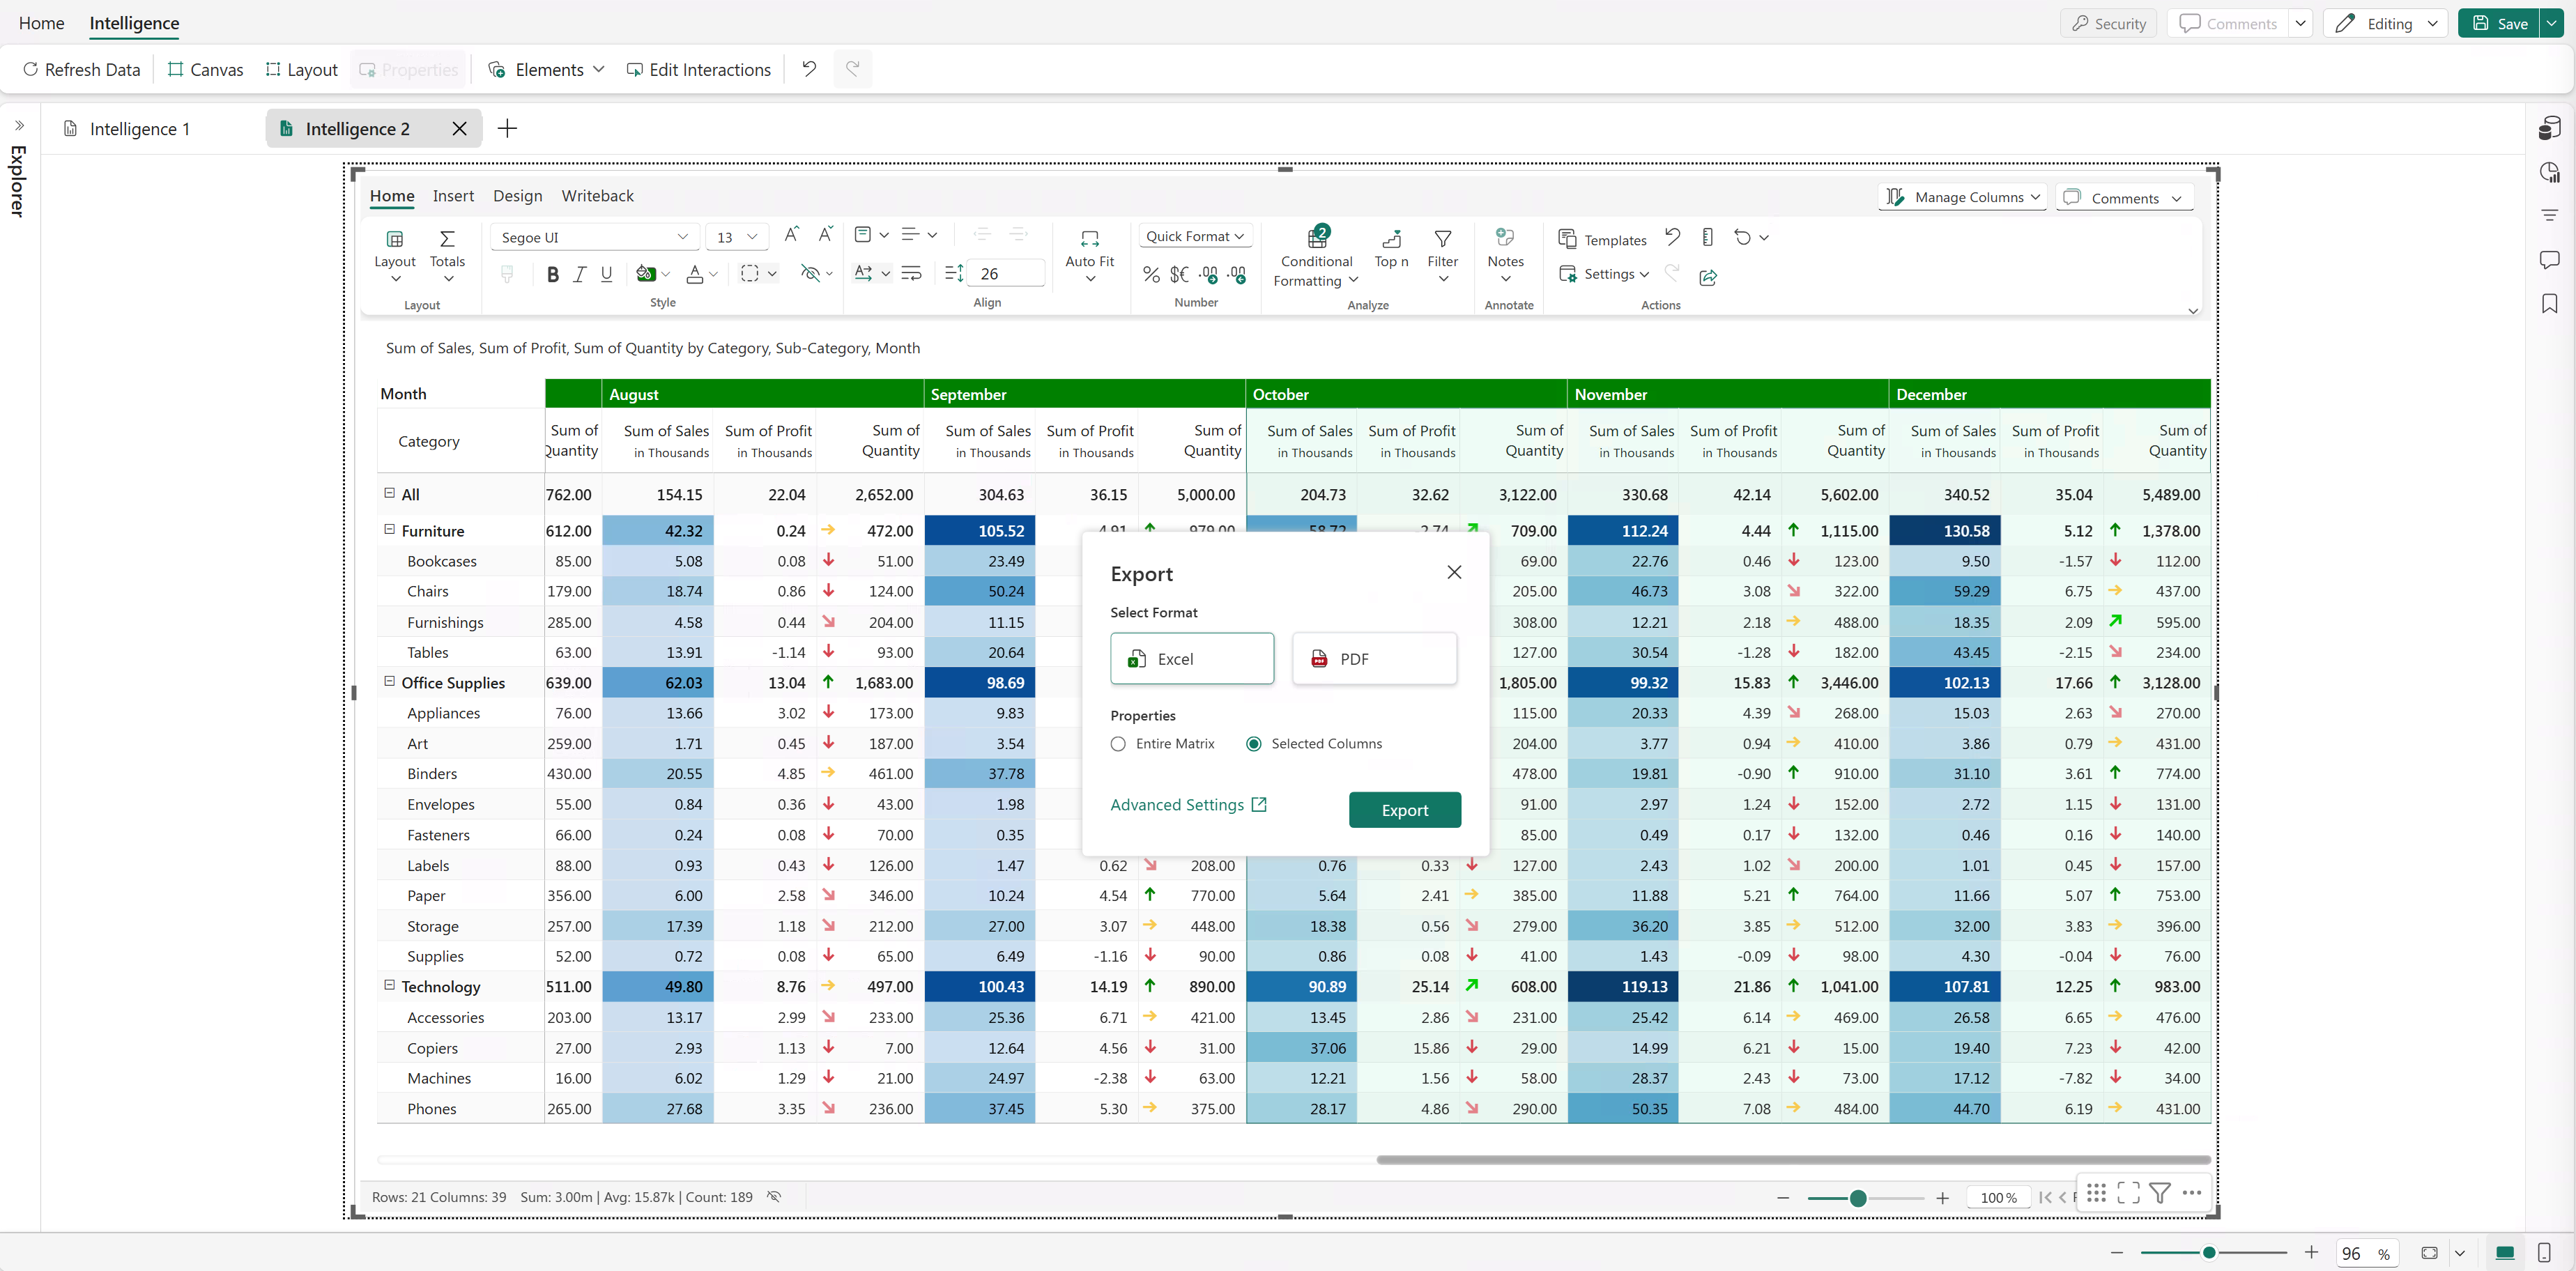
- To download the file, select the link.
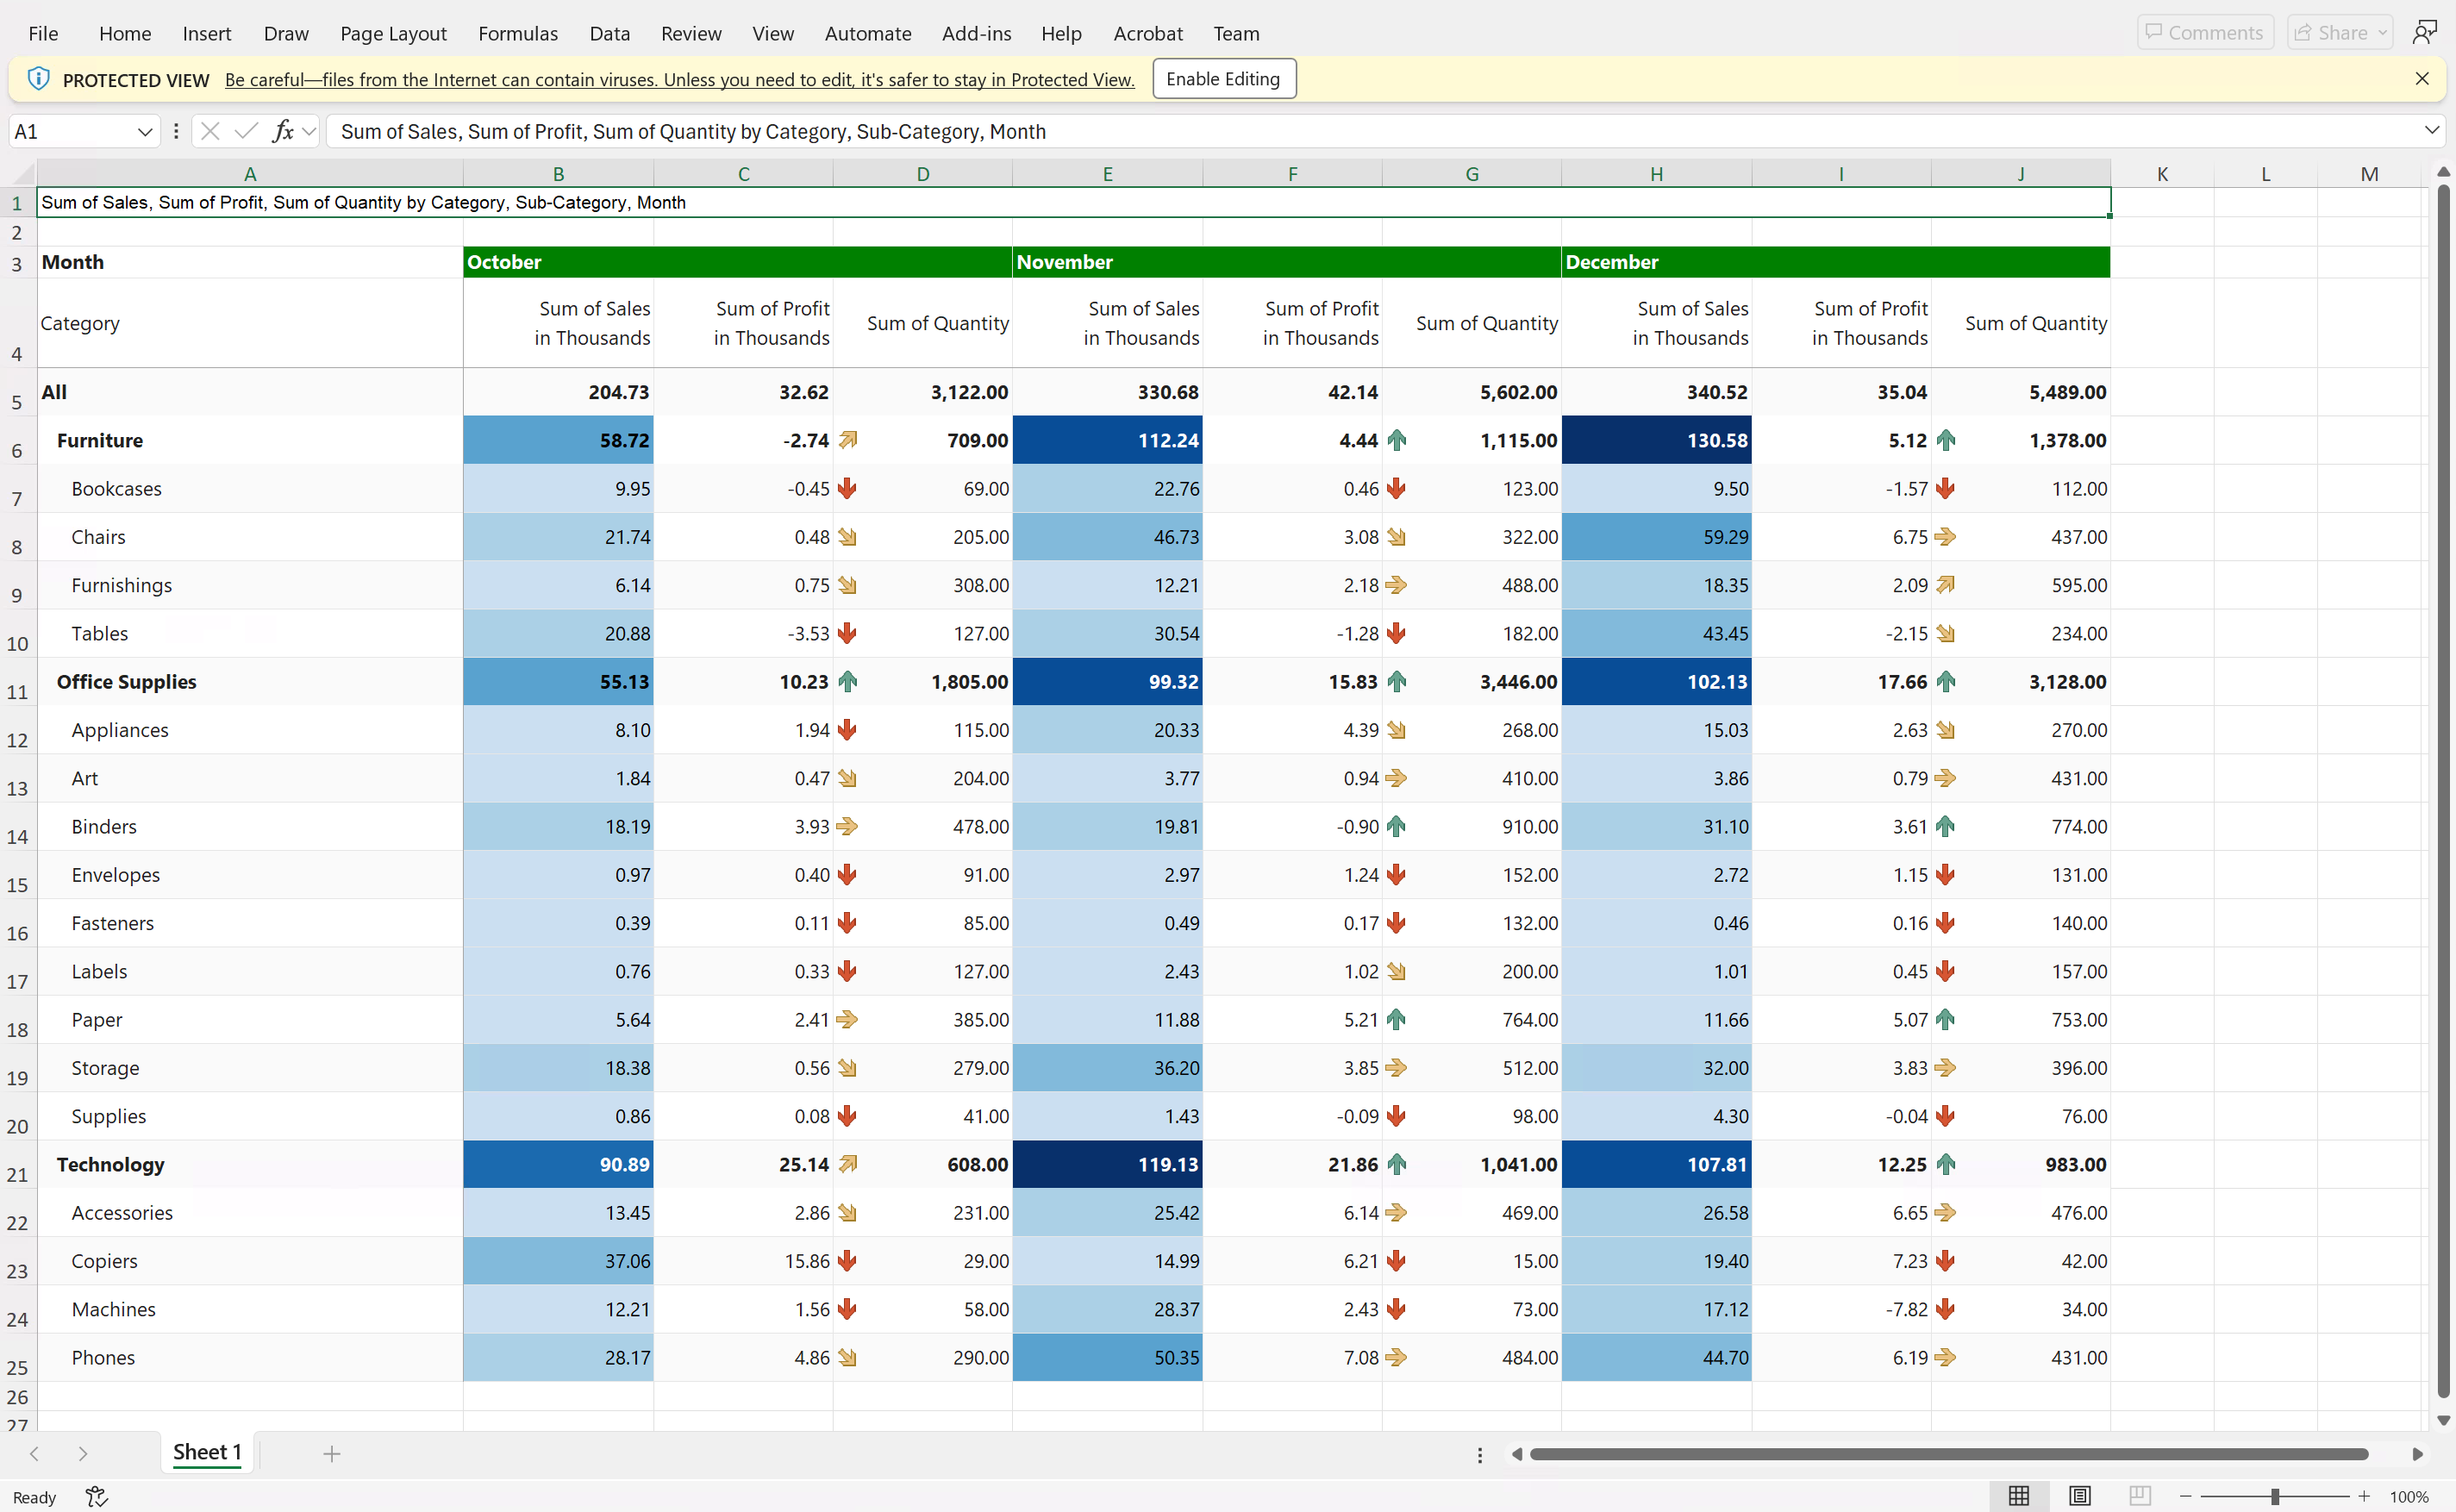
The following image shows a sample Excel export:
Import prebuilt templates for KPI cards
Choose from a set of prebuilt KPI card templates to quickly design dashboards and reduce setup time.
- Go to Export > Explore Templates.
- Select and download a template to apply.
- Return to the card visual, and then select Import from the Export ribbon.
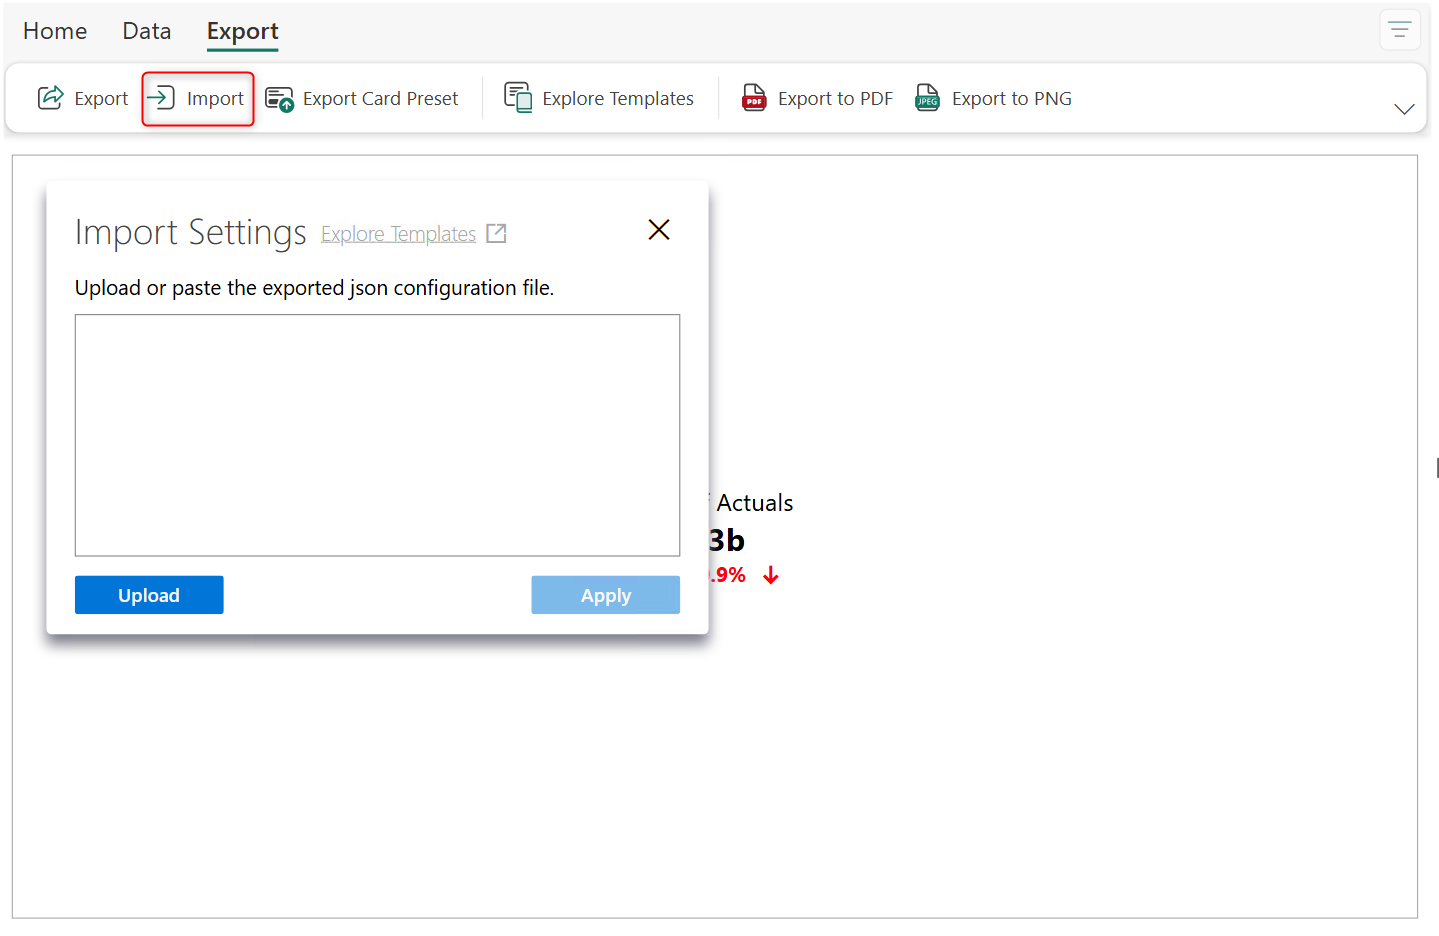
- Click Upload and select the template you downloaded in step 2.
- Map the measures to the sample measures used in the template.
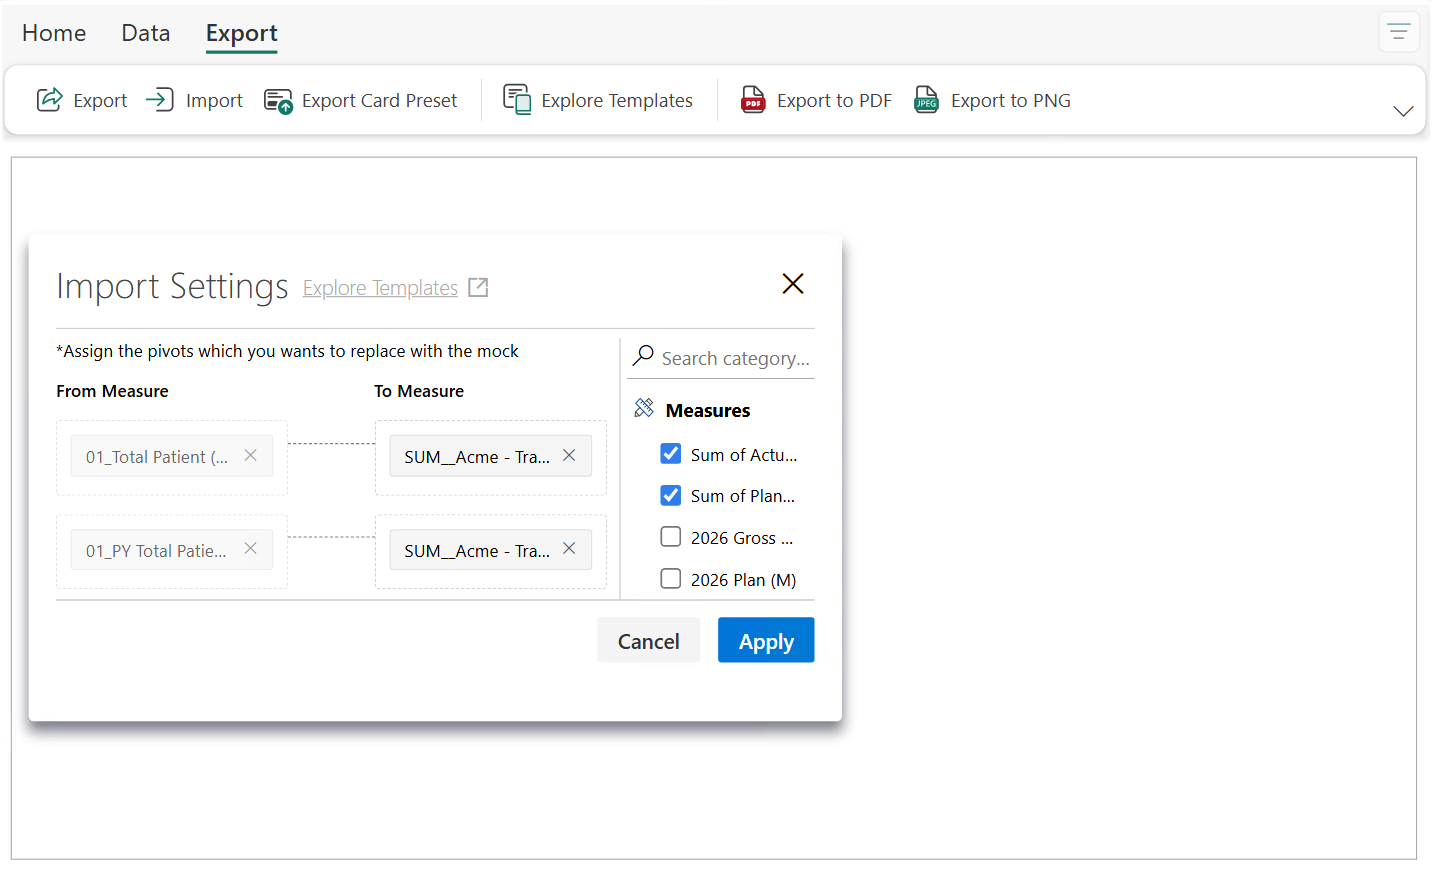
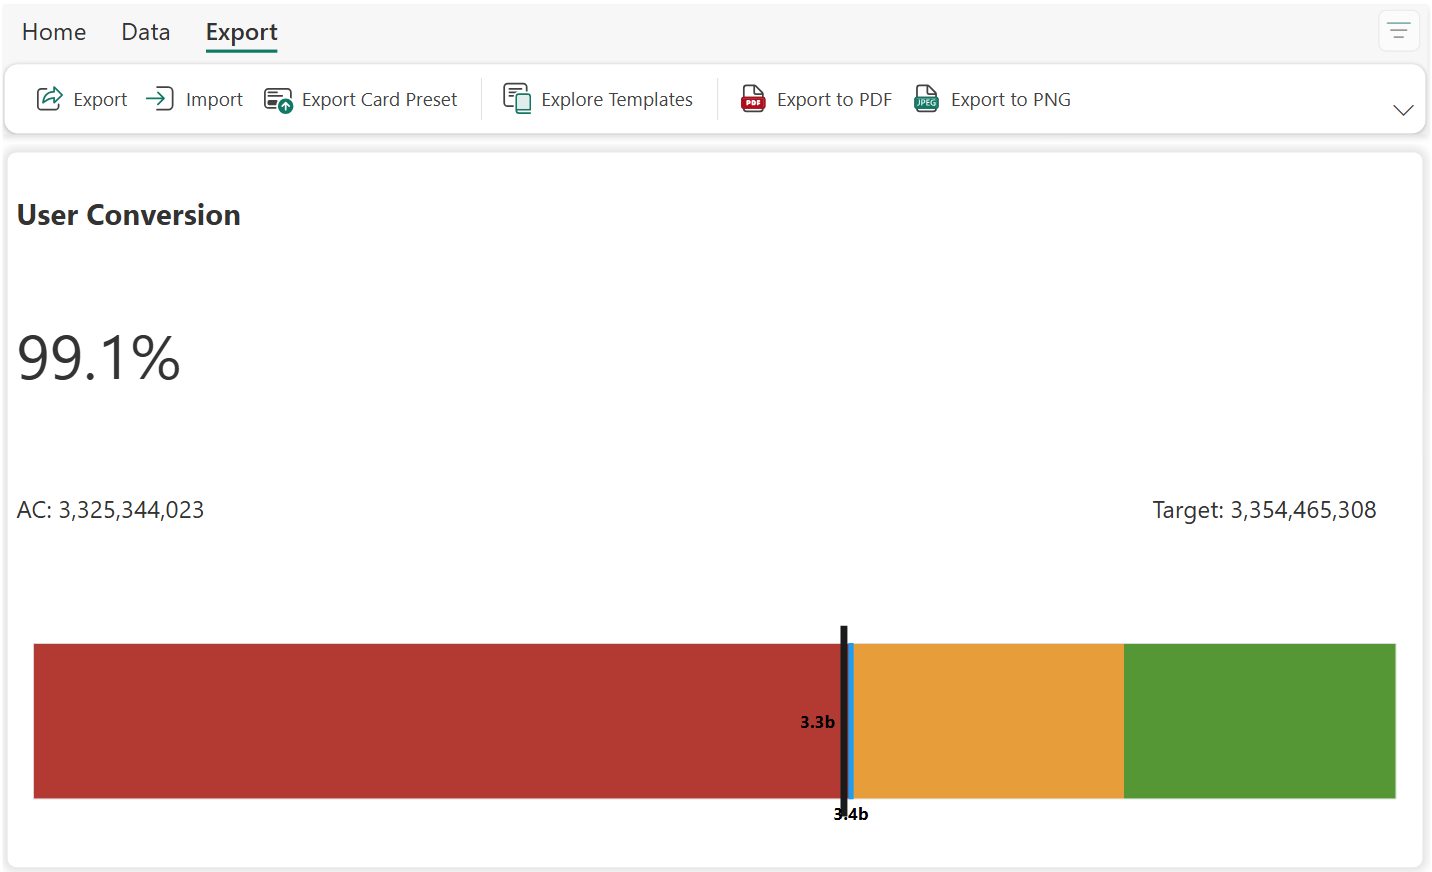
- Click Apply and when prompted, select Yes to confirm.
Export chart data
To export the data used to render the chart, right-click the visual, select Export, then select Data. The underlying data is saved as a CSV file.


