Calculates the sample variance of a dataset to measure how widely values are spread from the mean.
The VARS function returns the sample variance of a dataset. It measures how widely values are spread from the mean when the data represents a sample of a larger population. The calculation uses (n − 1) in the denominator to provide an unbiased estimate.
VARS(number1, [number2], ...)The VARS function syntax has the following arguments:
VARS(10, 20, 30)
// Returns 100
VARS(10, 20, 30, 40, 50)
// Returns 250
You can use the VARS function to analyze how widely values are spread from the mean by calculating the sample variance for metrics such as sales, revenue, or performance scores.
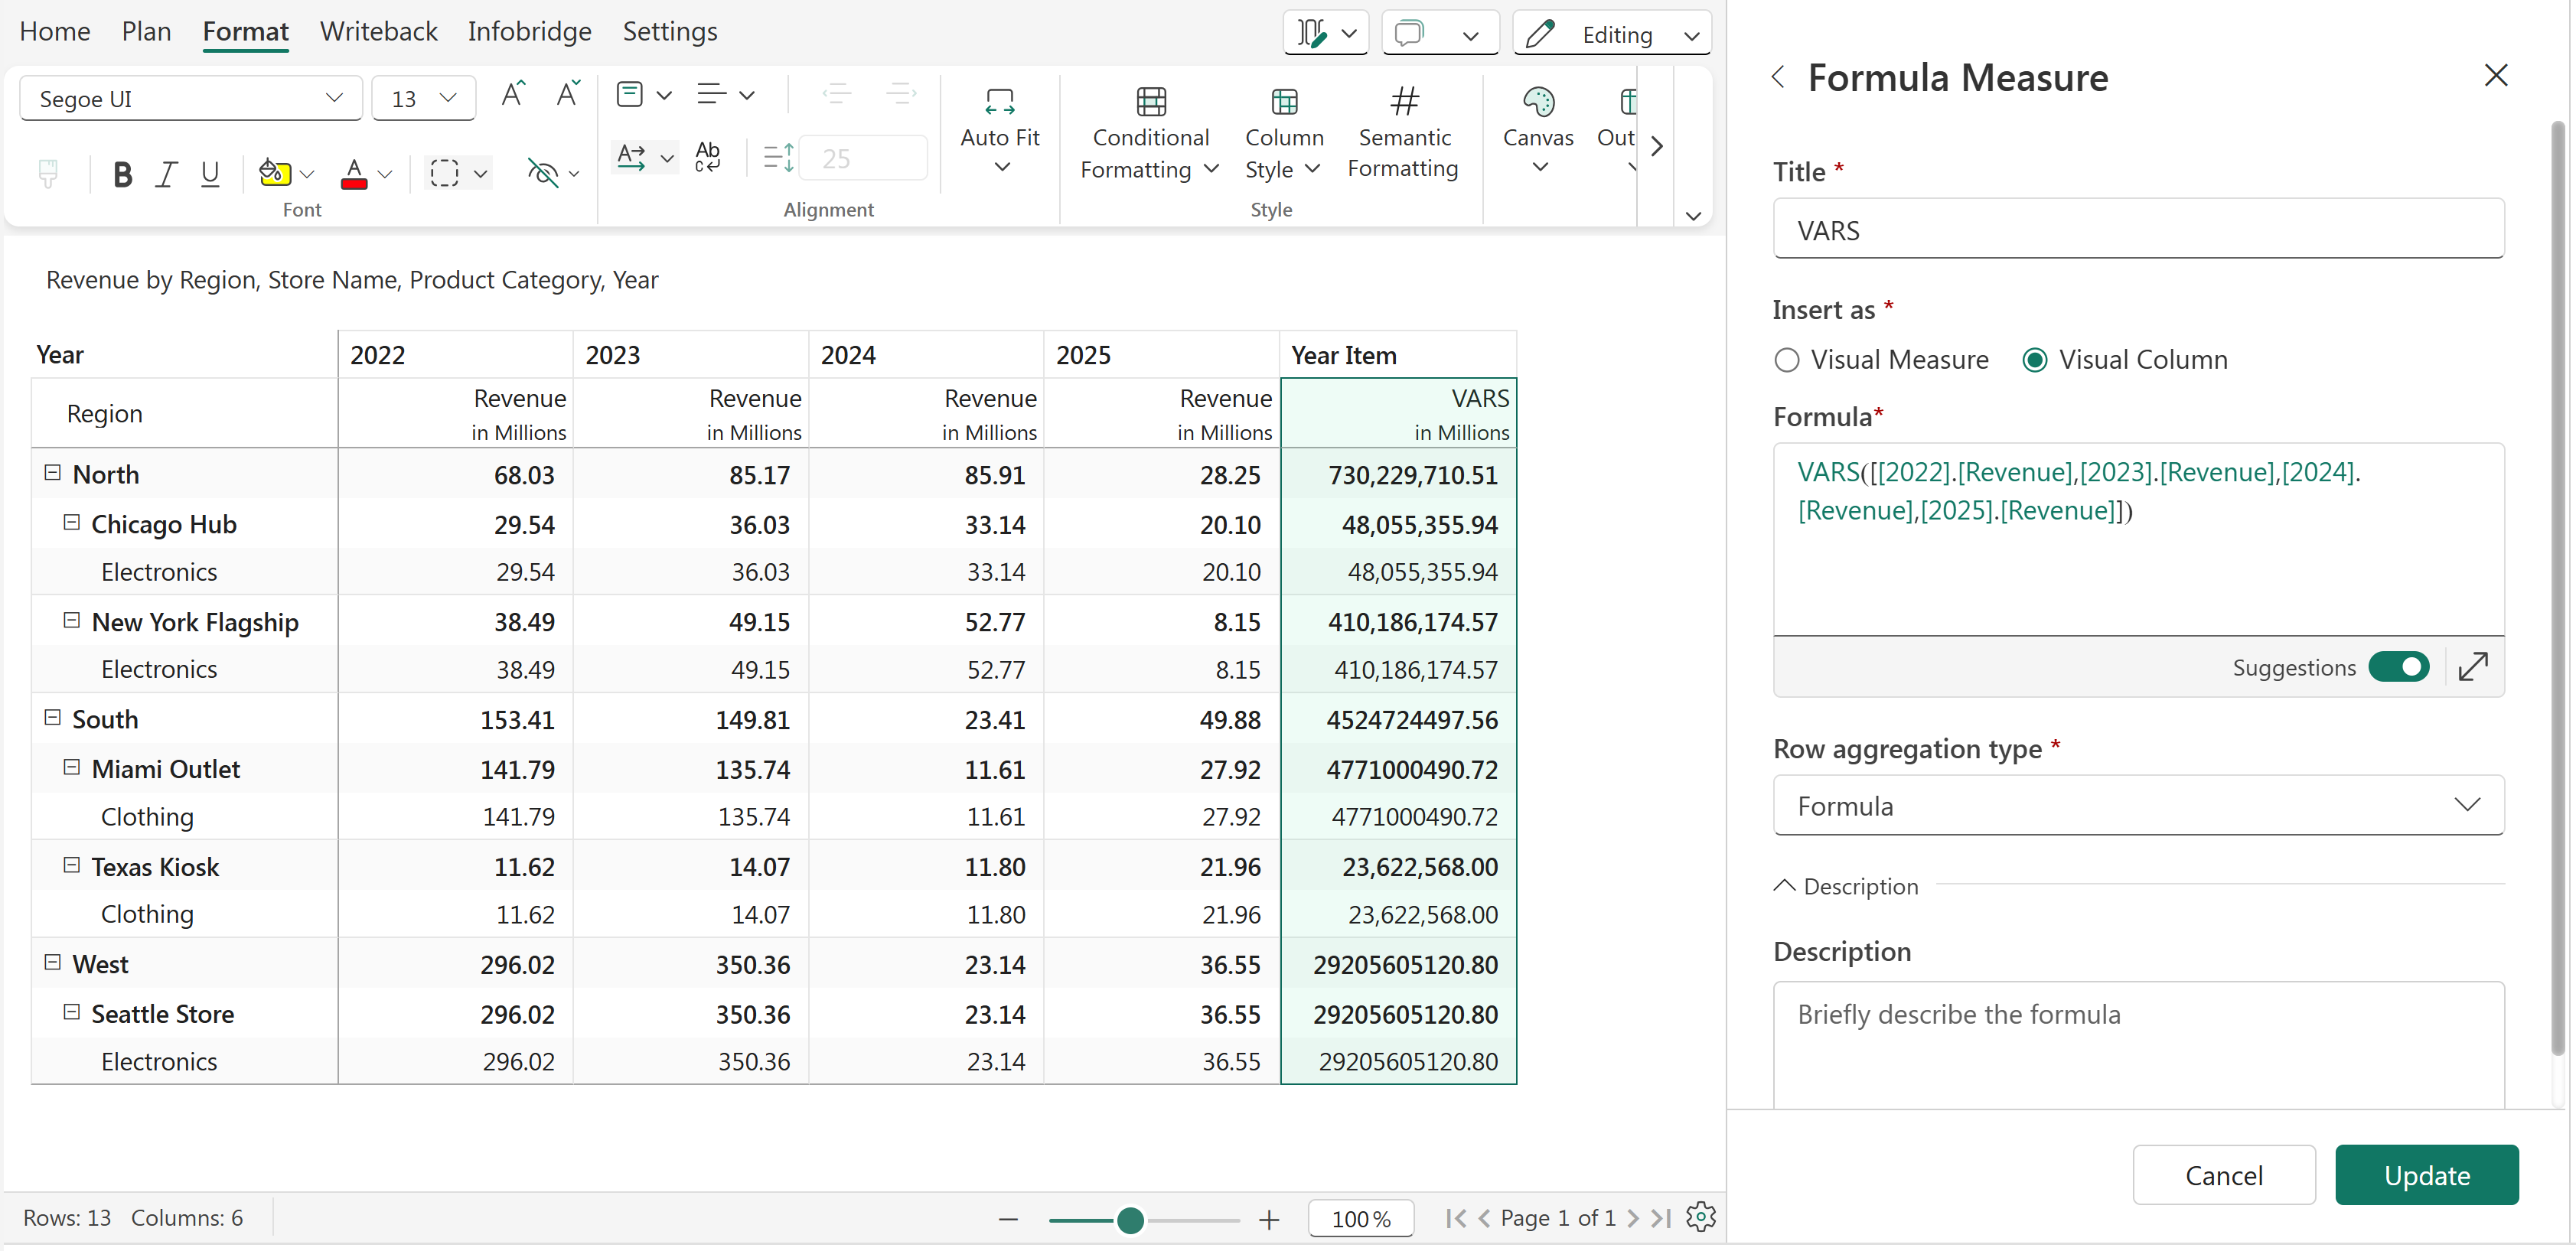
VARS function
We can also use the SELECT function to select a range of columns from 1 to 4 for the 'Revenue' measure (2022 Revenue - 2025 Revenue).
VARS(SELECT([Revenue], 1, 4))
Q1. How is VARS calculated?
VARS (Sample Variance) is calculated by taking the sum of squared deviations from the mean and dividing it by (n − 1).
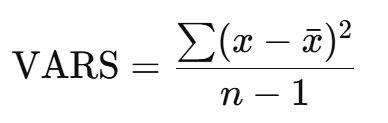
Where:
 = mean of the values
It measures how widely the values are spread from the mean by calculating the sample variance, which represents the average squared deviation from the mean.


